


6.4 Canada ’s Preparedness for Low-Carbon Growth: Detailed State-of-Play – Trade and market access
Framing the Future: Embracing the Low-Carbon Economy
Trade and market access
In a global economy, success in low-carbon competitiveness includes the efficient flow of low-carbon goods and services across geopolitical boundaries. As nations take action to reduce their GHG emissions and markets for low-carbon goods and services expand, the carbon intensity of imports and carbon risk of business ventures are gaining profile. Carbon-related trade barriers are beginning to materialize, with reputation shaping trade and investment-related decisions.
Understanding Canada’s trade profile within the global context is thus essential to exploring the country’s low-carbon competitiveness and the role of trade in supporting Canada’s low-carbon growth. Two dimensions come into play: new opportunities to export Canadian goods and services and contribute to global lowcarbon value chains, and measures to “green” the traditional economic base, particularly the energyintensive and trade exposed (EITE) sectors that are of strategic importance to Canada.
PROFILE IN BRIEF
As a small, open economy, Canada relies on trade for economic growth and prosperity.266 Although Canada’s dependence on trade may be less than it once was,267 trade remains a significant contributor to national GDP, and Canada’s further integration into global value chains is critical to its future prosperity.
Resource-sector exports figure prominently in Canada’s trade profile. Trade in resource-based products was dominant until the 1990s when manufactured goods — like industrial and agricultural machinery, transportation equipment, and consumer products — became Canada’s lead exports.268 Growth in the export of services and knowledge-intensive products characterized Canada’s trade profile in the 2000s, but remain a relatively small fraction of Canada’s overall trade today (15% of total exports in 2010).269 Analysis of export data indicates a steady and strong resurgence of resource-based exports over the last decade including energy products, metal ores, and processed metals.270 Together, these high-growth sectors accounted for approximately 38% of total exports in 2011, more than doubling their 2002 share.ee
Canada’s trade is heavily weighted toward emissions-intensive industries and products. Emissions-intensive sectors — that is, sectors exceeding 0.5 kt CO2e / GDP — accounted for 44% of Canada’s exports in 2010 (see Figure 20). With the steady growth in oil and gas extraction, mining, and primary metals manufacturing, the emissions intensity of Canada’s exports is on an increasing trajectory.ff
Figure 20

By far, the United States is Canada’s main import and export market, but a trend in diversification is apparent.gg Trade with the U.S. accounted for 74% and 50% of Canada’s goods exports and imports respectively in 2011, representing a drop in 13 percentage points compared to 2002 for both categories. And, while overall trade is growing in absolute terms, exports to the U.S. have declined 4% since 2002 and imports have risen by only 1%. Canada’s export shares to China and the U.K. have more than tripled between 2002 and 2011, and import shares from China have doubled over the same period.
LOW-CARBON PREPAREDNESS
Chapter 3 discusses trade in terms of economic risk to Canada if Canada delays in reducing the emissions intensity of the economy. This section considers how trade and trade-related policy can contribute to a prosperous low-carbon Canadian economy.
When it comes to trade, we looked at three indictors of low-carbon preparedness: (1) Canada’s trade relationship with key players in global low-carbon markets, (2) Canada’s current trade in LCGS relative to overall trade, (3) use of trade-related instruments to further low-carbon growth.
Overall, Canada is well positioned to benefit from the relative size and growth trajectories of its trading partners’ LCGS markets. At present, Canada’s top ten export markets are the U.S., the U.K., China, Japan, Mexico, South Korea, Netherlands, Germany, France, and Hong Kong; Canada’s top ten import markets are U.S., China, Mexico, Japan, Germany, the U.K., South Korea, France, Algeria, and Italy. Figure 21 shows the ten largest countries for LCGShh by market value as well as the growth rates for each country in 2009. Together, these nations represent 64% of the world low-carbon market.271 Seven of these nations — 42% of the world low-carbon market — are OECD members, and six — 49% of the world low-carbon market — are among Canada’s top 10 export markets.
Figure 21

Furthermore, analysis of Canada’s likely trading partners in 2040 undertaken by DFAITii projects growth in trade with nations that represent a larger portion of the world low-carbon market than today, and for which low-carbon market growth rates are high (see Table 12).
Table 12
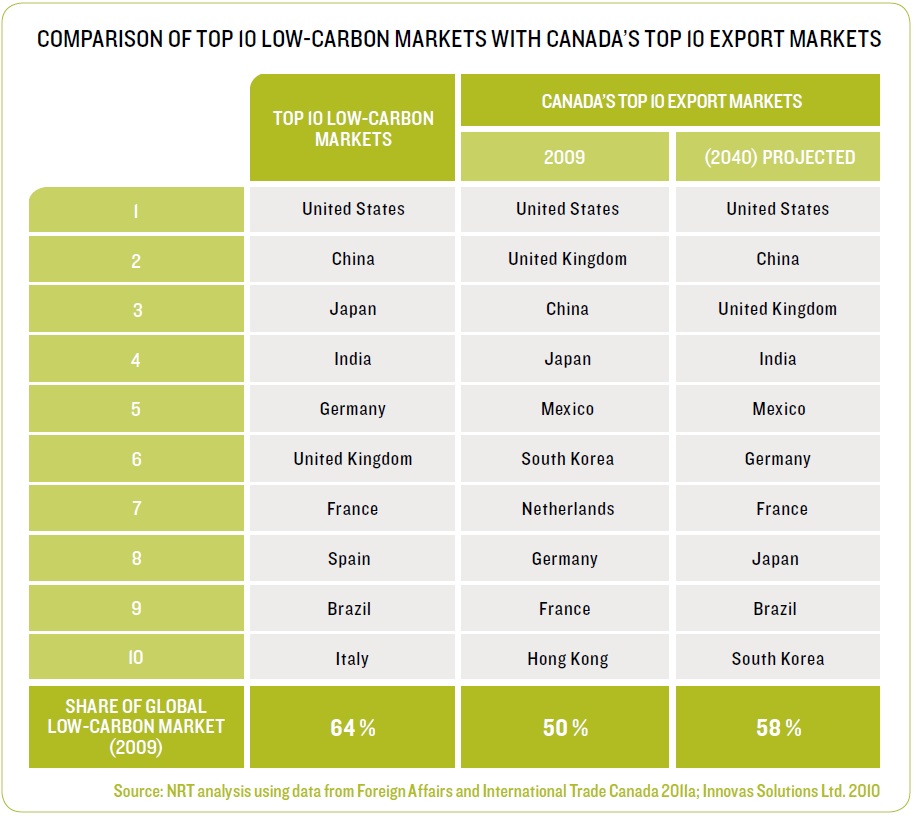
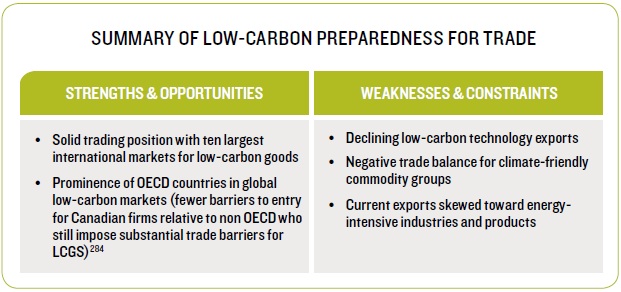
Even though Canada’s trade in low-carbon goods and services comprises a small share of trade overall,jj low-carbon activity aligns well with the global market opportunity. Low-carbon goods represent less than 1% of Canadian merchandise exports and approximately 1.6% of merchandise imports.272,kk What little low-carbon trade Canada does undertake, is largely captured by the top 10 low-carbon markets shown in Table 12. The United States is Canada’s largest market for 40 of the 45 commodities identified by the United Nations as “climate-friendly” and is the largest source of imports for 34 of the 45 commodities.273 Overall, 83% of Canada’s exports and 78% of imports of low-carbon goods are to the ten largest lowcarbon markets.274
Canada is failing to capitalize fully on the opportunity to sell its low-carbon services in global markets.275 Analysis of 45 climate-friendly commodity groups shows an overall negative trade balance of $3 billion for Canada. Exports amount to roughly $3.8 billion and imports roughly $6.8 billion net of re-exports (see Figure 22). Canada’s trade balance is positive for only 13 of the 45 climate-friendly commodities listed, and for 15 categories, net imports exceed domestic exports by a factor greater than 3:1.276 The country’s low-carbon export activity is stagnant, at best.277 Adjusting for inflation, Canada’s exports of low-carbon technologies declined by 2% annually on average over 2002 and 2008.278 Over the same period, the global low-carbon market experienced 10% annual compound growth and, with the exception of the U.K., the top 10 global exporters of low-carbon technologies experienced annual growth in excess of 5%.279
Figure 22

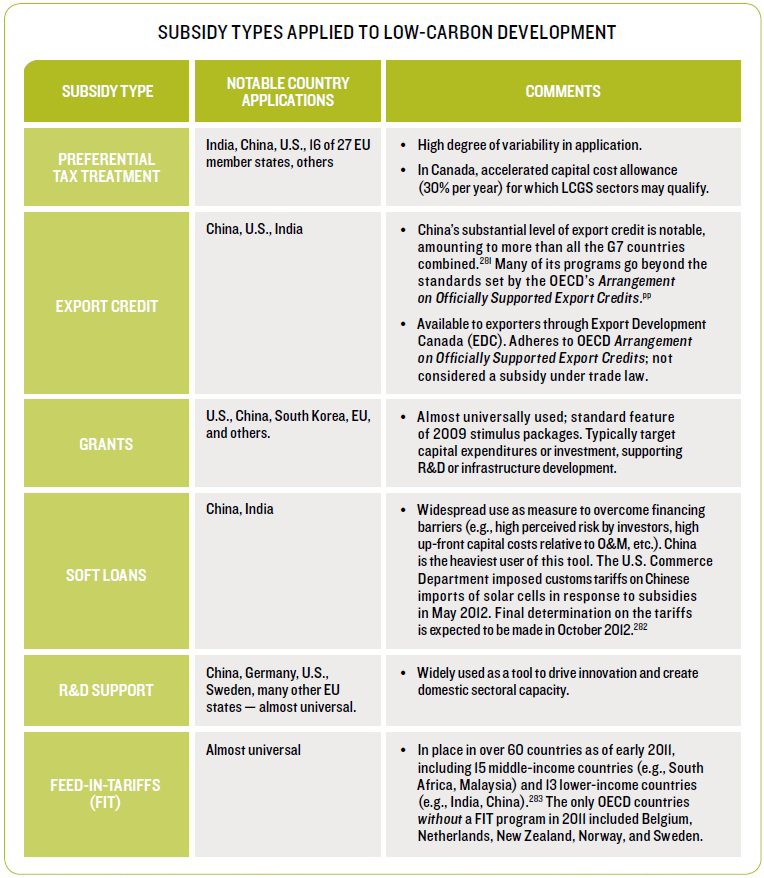
Relative to many of its trading partners, Canada makes little use of policy instruments to boost the domestic growth of low-carbon goods and services sectors and promote their export viability.ll Both direct (trade measures such as tariffs, subsidies and conditional subsidies) and indirect (domestic regulations, mandates or targets, and infrastructure investment) trade-related instruments exist and their application varies widely.mm For example, average tariff rates deployed by developing-country importers on low-carbon goods tend to be higher than their industrialized counterparts,280 with biofuels as an exception to this pattern.nn Subsidies are universally applied (see Table 13). Conditional subsidies or support, such attaching export performance conditions to subsidies, are uncommon and WTO-illegal. Domestic content requirements are broadly applied; China (Ride the Wind program) and India (Phase 2 of Jawaharlal Nehru National Solar Mission) use this tool extensively. Joint venture requirements are quite common in China, but not as common elsewhere. Ontario (currently being challenged at the WTO) and Québec currently make use of domestic content conditions for their feed-in tariff programs, but performance conditions are not widely employed in Canada. Export Development Canada (EDC) does provide some export credit financing; however, this could be bolstered to provide further dedicated support for low-carbon goods and services sectors.oo
Table 13
Trade and trade-related policy as well as trade instruments are also of relevance to Canada’s energyintensive and trade-exposed (EITE) industries. Where other nations are establishing carbon-related trade instruments, Canada can attempt to intervene to ensure fair treatment for its sectors (e.g., this was the case with the EU low-carbon fuel standard, and may be warranted were the U.S. to actively consider a national LCFS). In addition, as Canada moves to put in place regulations or appropriate price signals on GHG emissions, consideration must be given to measures for ensuring a level playing field with international competitors that may not be subject to the same controls / signals.
Table 14
[ee] Export categories included in this calculation include: energy products, metals and metal ores, and metals and alloys (Statistics Canada 2012g).
[ff] NRT analysis of DFAIT trade data.
[gg] The figures presented in this paragraph are based on NRT analysis of Industry Canada data (Industry Canada 2012).
[hh] This study included a broader segment of environmental goods and services in their overall categorization of “low-carbon and environmental goods and services.” Despite the inclusion of this additional market component it remains one of the most comprehensive surveys of global LCGS markets.
[ii] For their publication Canada’s State of Trade — Trade and Investment Update 2011, the Department of Foreign Affairs and International Trade undertook to project Canada’s top merchandise export markets in 2040. They employed an in-house gravity model along with a GDP forecast provided by IHS Global Insight.
[jj] Analysis undertaken by the Conference Board of Canada suggests that trade numbers may understate the degree of global business in low-carbon technologies (Goldfarb 2010). Global business in some technologies, and particularly those that are difficult to transport, is likely better captured by foreign direct investment. For example, cross-border investment is more important than trade in understanding global wind energy (Kirkegaard, Hanemann, and Weischer 2009). Particularly with the rise in importance of global value chains, trade cannot be looked at in isolation but must be considered together with inwards- and outwards-bound investment.
[kk] Because the provision of low-carbon goods and services tends to be highly integrated, we can draw conclusions on low-carbon services based on data on exports in low-carbon goods.
[ll] It should be noted that overall Canada’s trading partners are not making extensive use of tariffs as tools of green industrial policy; however, Canada’s use of such mechanisms is even more limited.
[mm] The discussion on trade-related policy primarily draws from an IISD report (Cosbey, Stiebert, and Dion 2012) commissioned by the NRT.
[nn] As an exception to this rule, on May 17th 2012, the U.S. imposed preliminary anti-dumping duties ranging from 31% to 250% on Chinese manufactured solar cells after ruling these products were sold below cost (Nicola 2012).
[oo] The Canadian Cleantech Coalition has developed a detailed proposal for export credit financing for the cleantech sector (Canadian Cleantech Coalition 2012).
[pp] While China is not a signatory, this agreement is widely regarded as an international standard (Cosbey, Stiebert, and Dion 2012).
[266] Hart 2002
[267] Armstrong 2011
[268] Hart 2002
[269] Foreign Affairs and International Trade Canada 2011a
[270] Statistics Canada 2012g
[271] Innovas Solutions Ltd. 2010
[272] Conference Board of Canada 2011b
[273] Conference Board of Canada 2011b
[274] Conference Board of Canada 2011b
[275] Goldfarb 2010
[276] Conference Board of Canada 2011b
[277] Goldfarb 2010
[278] Goldfarb 2010
[279] Goldfarb 2010
[280] Jha 2008
[281] United Steelworkers 2010
[282] Wingfield and McQuillen 2012
[283] REN 21 2011
[284] OECD 2005a