


Parallel Paths – 2.3 Research Approach
To explore more deeply the environmental and economic risks and opportunities for Canada from U.S. policy and from differences between Canadian and U.S. policy, the NRTEE applied a range of research tools, both qualitative and quantitative.
Our goal was to produce robust analysis that would provide new insight into the nature and size of these risks, then apply the learning from this analysis for consideration of alternative policy paths to move forward. Key research elements include the following:
- Assessment of Canada-U.S. energy, emissions, and trade characteristics and abatement cost curves
- Macroeconomic modelling of Canadian and U.S. climate and trade policy scenarios
- Assessment of implications of Canadian climate policy for linkage and alignment with U.S. policy
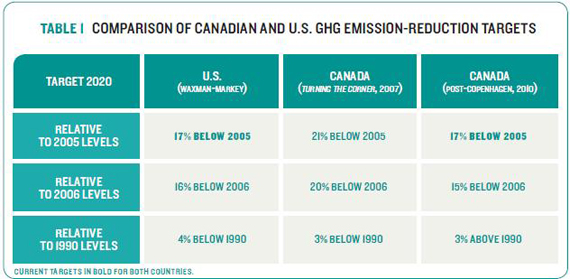
The starting point was Canada’s GHG emission reduction targets. Canada’s 2020 target has changed over the past few years. Until early 2010, Canada’s 2020 target was 20 % below 2006 levels. Now it is harmonized with the U.S. at 17 % below 2005 levels.9 This change of both target and baseline year (to 2005) translates into a reduction of Canada’s target of about 21 %. Table 1 compares the new 2020 medium-term target with the old, as well as what this means in terms of the 1990 Kyoto Protocol baseline.
ECONOMIC MODELLING AND SCENARIOS
The NRTEE’s economic modelling approach is focused on one snapshot in time: 2020. It does not explore pathways through time through 2020; it focuses instead on policy choices and outcomes in 2020. For political decision makers and government policy makers, the short-term impacts of policy choices are most meaningful. The year 2020 is an important milestone for contemplating Canadian climate policy choices and actions. First, it is only a decade away — 10 years is not a long time to implement effective climate policy and begin to see results. Second, 2020 reflects the actual medium-term stated targets for both Canada and the U.S. and will become a benchmark against which progress will be measured. Third, 2020 represents a pivotal time frame in which Canada can make progress toward a low-carbon economy and avoid a higher-cost approach to emissions reduction with resulting economic shock if there is a need to “go further, faster.”
Similar to previous reports, the NRTEE has again based its quantitative analysis on the most up-to-date modelling available. The model we used is a new version of the General Equilibrium Emissions Model (GEEM) — a computable general equilibrium (CGE) model — designed to assess the macroeconomic implications of a range of climate policy scenarios in both Canada and the U.S. The model improves on previous versions of GEEM in that it explicitly represents both Canadian and U.S. carbon policies and their impact on cross-border trade and capital movements as well as important metrics such as GDP, emission reductions, and trade surplus. Permit trade between Canada and the U.S. under an integrated Canada-U.S. cap-and-trade system is also tracked. National results are available for the U.S. with greater detail for Canada at the national, sectoral, and regional levels.10
We used the modelling to compare a range of policy scenarios against a reference case in which no new policies are implemented. Under the reference case, no cap-and-trade system is implemented in either Canada or the U.S.; the price of carbon is $0. Comparing policy scenarios in which different carbon-pricing policies are implemented in Canada, the U.S., or both, to this no-policy reference case allows us to isolate the impacts of these policies on emissions and on the Canadian economy. The reference case forecast implies average annual GDP growth rates to 2020 of 2.1 % for Canada and 2.3 % for the U.S. Based on the most recent public forecasts from both governments, it assumes Canadian emissions included in the model will increase by 10 % from 2005 in 2020 to 691 Mt, and by 1 % in the U.S. to 6,554 Mt. Both the Canadian and American reference case scenarios are based on macroeconomic forecasts from Informetrica Ltd.
Note that all dollar figures in this report are in 2005 Canadian dollars unless otherwise indicated.
DEFINITIONS FOR REFERENCE CASE AND POLICY SCENARIO
TWO TYPES OF SCENARIOS ARE RELEVANT FOR ESTIMATING EMISSION REDUCTIONS INDUCED BY POLICIES :
- The BUSINESS-AS-USUAL — or REFERENCE CASE — scenario is the forecast of emissions in the absence of additional policies.
- The POLICY SCENARIO is the forecast of emissions when a given policy or suite of policies is implemented.
To illustrate the policy issues and trade-offs and maintain a focus on medium-term climate-policy obligations, we have based our research and original economic modelling on the following core climate policies :
- AN ECONOMY-WIDE CAP-AND-TRADE SYSTEM in both countries, covering large emitters and the rest of the economy (including all energy and process emissions, but not including land-use changes and agriculture or carbon sinks such as forests), with various options to limit competitiveness risks by setting a maximum carbon price.
- SOME LIMITED ACCESS TO INTERNATIONAL PERMIT PURCHASES to reduce costs and maintain competitiveness, but capped to ensure some domestic reductions occur.
- FREE PERMIT ALLOCATION TO LARGE EMITTERS as output-based allocations in order to reflect trends toward free permits in U.S. legislative proposals, and revenue recycling to reduce both corporate and income tax. This approach would reflect a neutral distribution. Revenue is roughly distributed back to households and firms in the proportion in which it was collected. While the output-based allocations are used for our central scenarios, we explore variations on this assumption to further address regional impacts.11
- TWO MAIN POLICY APPROACHES FOR THE U.S. : An economy-wide cap-and-trade system with a cap of 17 % below 2005 levels and with limited international permit choices (paralleling the system modeled for Canada as described above) and a policy consistent with both the proposed Waxman-Markey and Kerry-Lieberman bills to represent a real-world possible American climate policy framework. The Waxman-Markey real-world U.S. policy scenario includes much more substantial cost-containment in the form of domestic and international offsets, and as a result, has a lower price of carbon.
All policy scenarios are driven by cap-and-trade policies that impose a carbon price. We focus on carbon pricing as the primary and most cost-effective driver of climate policies in Canada and in the U.S. for several reasons. This was the conclusion of previous NRTEE reports Getting to 2050 and Achieving 2050. Carbon-pricing policies continue to be policyrelevant in both countries. The Western Climate Initiative is scheduled to begin in 2012 with two states and three provinces on track for having operational trading systems. While the U.S. House of Representatives passed the Waxman-Markey bill, which contained an economy-wide cap-and-trade system, the Senate has failed to follow suit. Regulation from the U.S. Environmental Protection Agency (EPA) may prove to be the likely next federal step in the U.S. EPA regulations could apply forms of market instruments that create a carbon price signal.
Our focus on cap-and-trade in this report does not preclude the importance of other policy instruments. As we suggested in Achieving 2050, complementary policies and regulations in support of a carbon pricing policy can further improve the cost-effectiveness of policy by targeting sectors difficult to include under a cap-and-trade system and sectors that are slow to respond to carbon prices. Yet carbon-pricing policy is still central to achieving emission reductions at least cost. It is also central to the risks of competitiveness discussed in this report: if other jurisdictions have lower carbon prices than Canada, Canadian industry would experience a competitive disadvantage and would experience some economic impacts as a result. In assessing implications for competitiveness of different policies in Canada and the United States, carbon prices therefore are a useful and important point of comparison.
Finally, though we have chosen to frame our policy scenarios as cap-and-trade scenarios in the report, they could also be considered as more broadly representative climate-policy scenarios. Modelling scenarios with permit auctions and recycling could be considered representative of applying a carbon charge, and even scenarios with free permit allocations are comparable to a carbon charge in which significant revenue is recycled back to firms. Even a regulatory, rather than a market, approach as being considered by the Environmental Protection Agency in the U.S., is associated with an implied price on carbon. The difference in the regulatory case is that it does not apply a common, consistent carbon price across the economy as a whole, and thus may actually have higher costs due to decreased efficiency. A more stringent regulatory regime in Canada relative to the U.S. has clear parallels to a higher carbon price in Canada relative to the U.S.
As the NRTEE has stated in previous reports, there is inherent uncertainty when modelling the economic impacts of climate policy. It cannot account for independent actions or unforeseen events that might upset original parameters or change economic and financial behaviour by governments, firms, or consumers. Modelling is a very useful tool for informing policy choices but should not be treated as a precise predictor of outcomes. Instead, modelling provides its greatest value in the insights and learning that result from such quantitative analysis. Models are a representation of the real world, not a perfect copy. To provide useful insight, models use scenarios to assess choices and consider impacts. Given the high range of uncertainty surrounding American climate policy, we developed a comprehensive range of scenarios to model, and did not just rely on current legislative proposals. This amounted to eight core scenarios, with approximately 25 additional variations explored to assess specific policy options or issues, and over 100 different model runs completed. Specific details on the full range of modelling scenarios can be found in Appendix 7.5. The core scenarios are described below.
To explore key risks and opportunities for Canadian climate policy, the NRTEE scenarios focused on three main areas :
- Key timing and harmonization risks for Canada
- Risk management opportunities for Canada
- A transitional policy option to manage risks and move forward in the face of continued U.S. uncertainty.
SCENARIOS TO EXPLORE TIMING AND HARMONIZATION RISKS
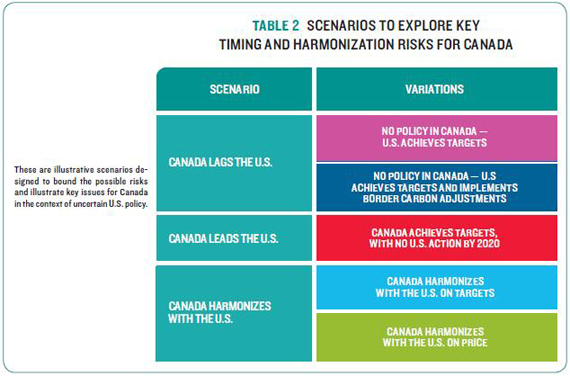
In the context of U.S. and Canadian climate policy, timing of policy and the relative stringency of policy are key risk drivers for Canada : What are the implications if Canada implements a policy to achieve its targets and the U.S. does not? And if both implement policies to achieve their targets, what are the implications for carbon prices in Canada and in the U.S.? We explored these issues with three illustrative scenarios: Canada Leads, Canada Lags, and Canada Harmonizes with the U.S. Scenarios were then parsed with considerations of “no U.S. action” for Canada Leads; “U.S. implements border carbon adjustments” for Canada Lags; and “harmonization on price” and “harmonization on targets” for Canada Harmonizes with the U.S. Specific scenarios are outlined in Table 2:
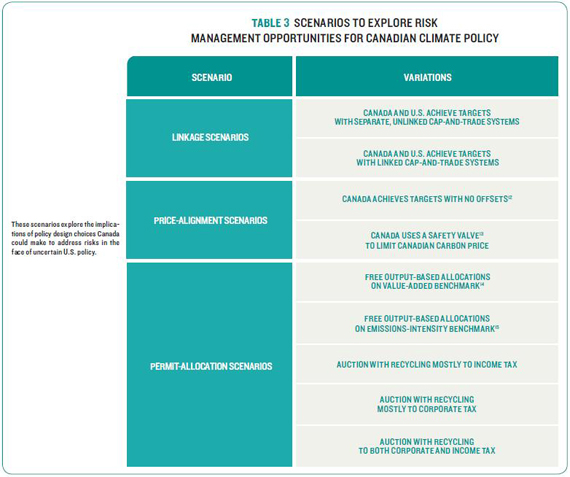
SCENARIOS TO EXPLORE RISK MANAGEMENT OPPORTUNITIES FOR CANADIAN CLIMATE POLICY
Scenarios modelled here explore how Canadian climate policy can be set to reduce economic and environmental risks to Canada. Specifically, they explore linking cap-and-trade systems, aligning on carbon price, and employing various permit allocation methods to recycle revenue in order to minimize competitiveness impacts on industry sectors and address regional balance concerns. Each of these can help reduce economic risks by reducing the difference between Canadian and U.S. carbon prices or by addressing regional and sectoral impacts. In turn, they give policy makers a more complete understanding of what policy choices and design options can bring. Specific scenarios are outlined in Table 3 :
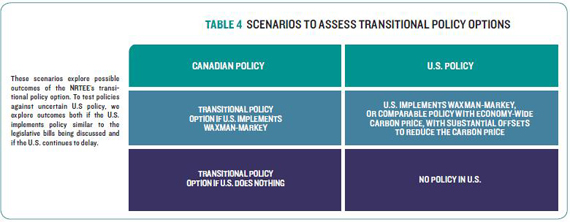
SCENARIOS TO EXPLORE A TRANSITIONAL POLICY OPTION FOR CANADA
The last set of scenarios has the most detailed policy assumptions. These scenarios are meant to consider the implications of a new, transitional policy option and assess whether such an option could be viable for Canada in the run-up to 2020. The option makes the Canadian carbon price contingent on the U.S. price. The scenarios consider implications both if Canada faces continued uncertain U.S. climate policy or if the U.S. implements a Waxman-Markey-like policy with an economy-wide carbon price through a cap-and-trade system and extensive offsets, which would likely keep the carbon price around $30 / tonne CO2e.16 A transitional policy option would seek to make progress on achieving Canada’s environmental goals for 2020, but also minimize the economic or competitiveness impacts along the way. While we modelled U.S. policy in these scenarios as a stylized version of Waxman-Markey, it is broadly representative as a real legislated policy for the U.S. Analyses of proposals such as Waxman-Markey, Kerry-Boxer, and Kerry- Lieberman all impose comparable carbon prices of around $30/tonne CO2e, and are thus broadly consistent with our representative scenario.17
STAKEHOLDER ENGAGEMENT
The research scope, framing, and analysis for this report have been guided and informed by outside experts at each stage of our work. An expert advisory committee met in July and November, 2009 to give feedback on how the research was framed and what the results meant. A technical peer review panel examined our detailed analytical findings to ensure that their accuracy and characterization were valid. Two subsequent stakeholder sessions in Calgary and Ottawa in early 2010 previewed results and the transitional policy option, giving us valuable feedback on its viability. To assess American reactions and U.S. government and Congressional progress on the file, the NRTEE held a stakeholder consultation session in partnership with the Woodrow Wilson Center for Scholars in Washington D.C. in January 2010. The purpose of meeting with U.S. climate policy experts was to ensure our assumptions, analysis, and findings accurately reflected current U.S. policy and other related considerations.
[9] Environment Canada (2010, February).
[10] See Appendix 7.3 for a more detailed explanation of the GEEM model.
[11] Similar to the NRTEE’s proposal in Achieving 2050 as well as the proposed U.S. cap-and-trade design in the Waxman-Markey and Kerry-Lieberman proposals, the cap is imposed both on large emitters and on fuel distributors in order to ensure economy-wide coverage of the program.
[12] Offsets are emission reductions created outside the cap-and-trade system. They could include international abatement opportunities or domestic reductions in emissions not covered under the cap-and-trade system (such as forestry or agriculture). See Glossary and Chapter 4 for details.
[13] A safety valve limits the price of carbon in a cap-and-trade system. See Glossary and Chapter 4 for details.
[14] Value-added measures the value of a sectors’ output less the value of its inputs. It can represent the sector’s contribution to GDP.
[15] Emissions intensity is the number of GHG emissions produced per unit of output produced.
[16] CO2e, or carbon dioxide equivalent, is the unit used to measure combined emissions of all greenhouse gases.
[17] U.S. Environmental Protection Agency, Office of Atmospheric Programs (2009); Parker, L., et Yacobucci B.D. (2009); Congressional Budget Office (2010); U.S. Environmental Protection Agency, Office of Atmospheric Programs (2010).