


Parallel Paths – 2.1 The Canadian-American Trade, Energy, and Emissions Relationship
The differences between Canadian and U.S. emissions profiles and energy economies, combined with their high level of integration, lead to complex implications for Canadian and U.S. climate policy.
Much of Canada’s wealth and well-being is attributable to our success as a trading nation, and in particular, trade with the United States. The U.S. is the largest market for Canadian exports, and the largest single source of Canadian imports. In 2008, over 77 % of Canadian exports were destined for U.S. markets. The U.S. is the primary destination for Canada’s largest exporting sectors, including our energy and agricultural sectors. The U.S. accounts for around 65 % of Canadian imports, with the leading sectors being automobile manufacturing and parts, followed by the aerospace industry.
The characteristics of the two economies and the trade flows between them provide important context for discussions on Canada-U.S. climate policy issues. On the one hand, because of the high level of trade integration between the two countries, climate and energy policy choices in the U.S. have both economic and environmental implications for Canada. Differences in policies can lead to competitive advantages for firms in one country. On the other hand, Canada and the U.S. have different energy sources, emissions profiles, forecasted rates of emissions growth, and costs of reducing emissions. While there are obvious complementary elements, crafting a Canadian clean-energy strategy that seeks to integrate economic, environmental, social, and regional factors suggests that a uniquely Canadian policy approach — complementary but different — could best meet Canada’s needs.
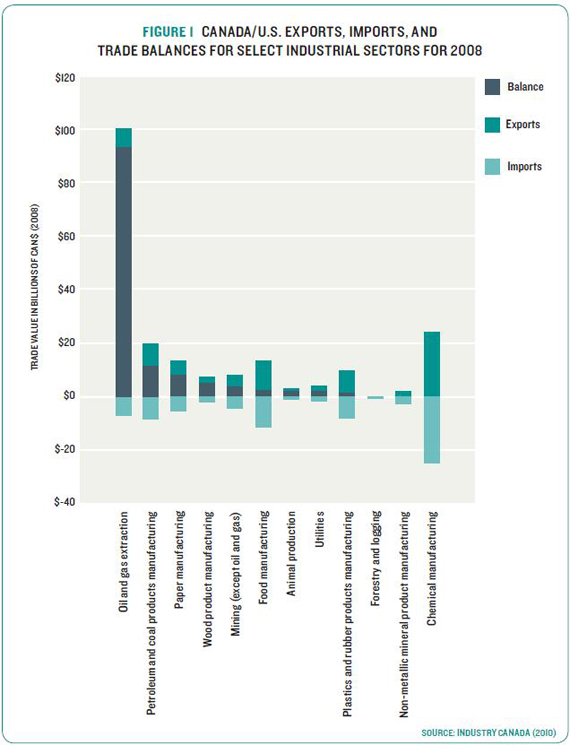
Figure 1 depicts the exports, imports, and trade balance between Canada and the U.S. by sector. In 2008, Canada had major trade surpluses with the U.S. in oil and gas extraction, petroleum and coal products manufacturing, paper manufacturing, and wood product manufacturing. Canada’s exports to the U.S. are significantly less diverse than U.S. exports to Canada. The oil and gas industry is now the largest source of Canadian exports to the U.S., after nearly doubling in value over the last five years.
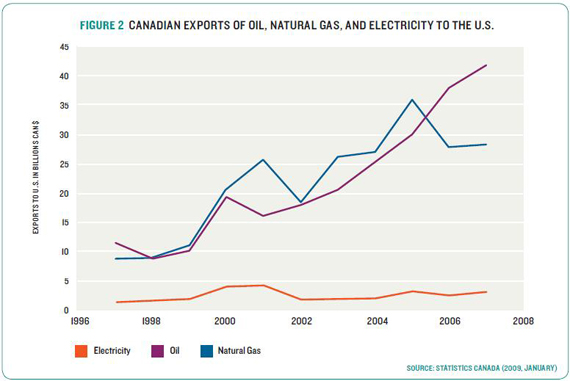
The value of Canadian energy exports to the U.S. has grown substantially in the past decade. Oil exports now total more than $40 billion a year while natural gas exports are more than $28 billion a year. As shown in Figure 2, this growth is primarily due to an increase in oil and natural gas exports (and rising prices for these commodities). Revenues from electricity exports have, by contrast, remained relatively flat over the same period, in the range of $1-4 billion per year.
Two key differences between the Canadian and U.S. economies are critical in the context of climate policy.
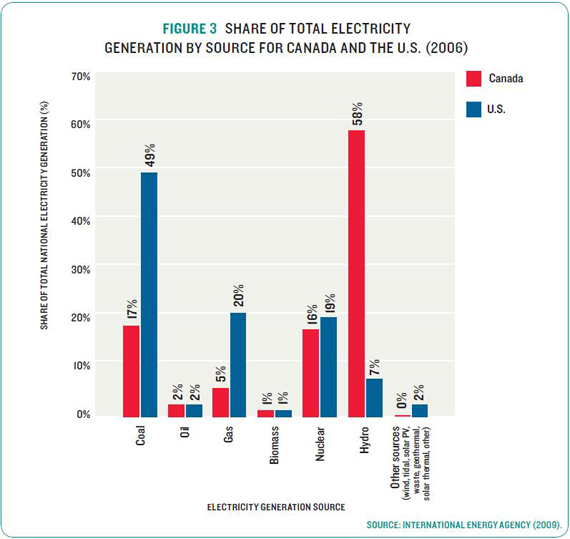
The first key difference lies in the composition of energy sources used for electricity generation between Canada and the U.S. As indicated in Figure 3, the majority of electricity generated in Canada comes from hydroelectricity. Canada is the world’s second -largest producer of hydroelectricity, following China. This abundance of hydro power means that Canada is much less dependent on coal-fired power plants for electricity than many countries — the U.S. included. In the U.S., significantly more electricity comes from coal and natural gas as compared with Canada. These differences have implications for Canada-U.S. climate policy. On the one hand, electrification in Canada provides greater emission reductions due to Canada’s lower emissions intensity of electricity generation. Canada’s low-carbon generation provides it with a potential competitive advantage relative to the United States’ fossil-fuel intensive generation. On the other hand, while moving away from emissions-intensive coal-fired electricity in the U.S. is a significant and expensive challenge, this shift would drive substantial emission reductions.
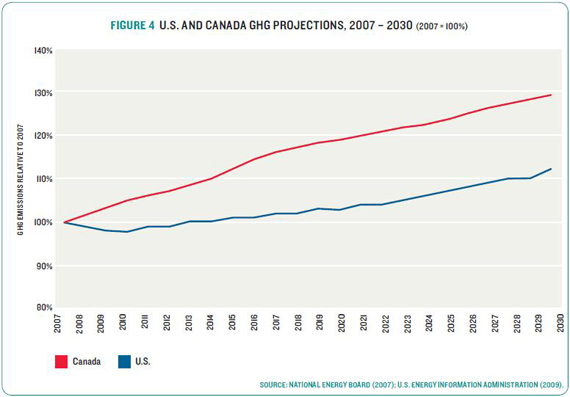
A second key difference between Canada and the U.S. is higher projected emissions growth in Canada as shown in Figure 4. Relatively faster emissions growth in Canada implies a greater level of effort (and higher carbon prices) to reduce emissions and meet the stated targets for Canada relative to the United States. This difference suggests that Canada would have to reduce more emissions than the U.S. to achieve the same target relative to 2005. The costs of abatement for Canada to 2020 will depend on whether Canadian policy seeks to harmonize with the U.S. on targets or on price. We explore the issue of Canadian and U.S. marginal abatement costs in Chapter 3. These forecasts are the most recent publicly available. They may overstate the difference somewhat between the two countries as slower economic growth since 2007 has not been accounted for in the Canadian forcast from the National Energy Board, while it has for the U.S. forecast from the Energy Information Administration. This means Canadian emissions in 2020 and beyond could be lower than shown. One key difference in Canadian emissions growth is projected rapid oil sands growth.
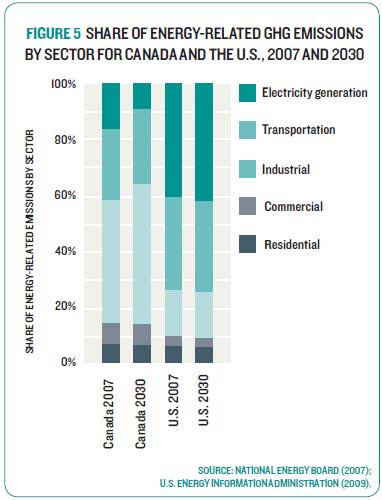
Sector-level differences between Canada and the U.S. parallel national differences. First, Canada’s access to hydroelectric generation — as discussed above — greatly diminishes emissions from the electricity generation sector in Canada, relative to the U.S. Second, Canada’s industrial emissions account for a much higher share of overall GHG emissions than do industrial emissions in the U.S.3 This difference is partly indicative of relatively fewer emissions from electricity generation in Canada, but it also reflects the emissions intensity of Canada’s industrial sectors, particularly the mining and oil and gas extraction sectors. Industrial emissions have shown strong growth in the past decade in Canada and are predicted to continue to grow in relative importance. As reflected in Figure 5, emissions from industry are forecast to account for nearly 50 % of total GHG emissions in Canada in 2030 — compared to around 15 % in the U.S. Again, these differences are important in the context of climate policy: the U.S. must address emissions from coal-fired electricity, while to make comparable reductions, Canada must address emissions from a range of industrial sectors, including its emissions-intensive resource sectors.
[3] However, abundant hydro power does not necessarily translate into a common advantage across regions in Canada; it is concentrated in British Columbia, Québec, Manitoba, and Newfoundland and Labrador. In Ontario, the provincial government maintains that it will close its four coal-fired plants (Atikokan, Lambton, Nanticoke, and Thunder Bay) by December 31, 2014, citing environmental and health concerns. The government plans to replace coal-fired capacity with natural gas, nuclear, hydroelectricity, and wind, along with increased conservation measures. At present, coal provides about 16% of Ontario’s electric power. In the National Energy Board’s 2009 reference case, the retirement of Ontario’s coal-fired facilities is offset by increases elsewhere in the country — notably, Alberta and Nova Scotia. As a result, Canada’s coal-fired generation rises modestly, from about 106 billion kilowatt hours in 2006 to 128 billion kilowatt hours in 2030.