


Chapter 7: Appendices
Reality Check: The State of Climate Progress in Canada
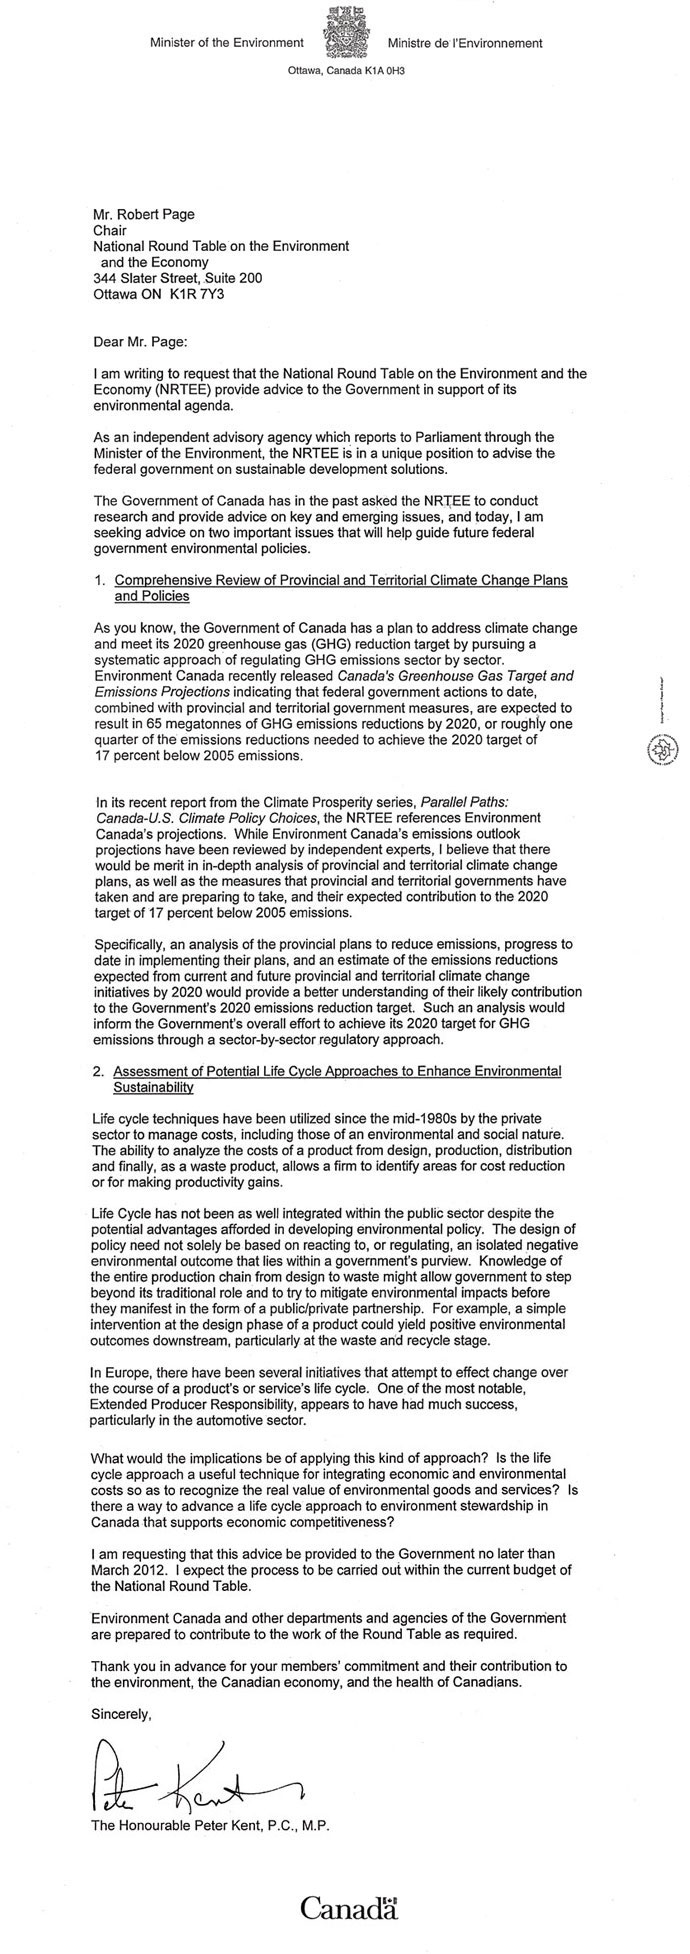
7.1 Ministerial Reference letter
7.2 CIMS model
CIMS is an energy-economy model that is maintained by Navius Research, Inc. and the Energy and Materials Research Group at Simon Fraser University.t CIMS has a detailed representation of technologies that produce goods and services throughout the economy and attempts to simulate capital stock turnover and choice between these technologies realistically. It also includes a representation of equilibrium feedbacks, such that supply and demand for energy intensive goods and services adjusts to reflect policy.
CIMS simulations reflect the energy, economic and physical output, GHG emissions, and CAC emissions from its sub-models as shown in Table 9. CIMS does not include adipic and nitric acid, solvents or hydrofluorocarbon (HFC) emissions. CIMS covers nearly all CAC emissions except those from open sources (e.g., forest fires, soils, and road dust).
TABLE 9: SECTOR SUB-MODELS IN CIMS
| Sector |  BC BC |
 AB AB |
 SK SK |
 MB MB |
 ON ON |
 QC QC |
    Atlantic Atlantic |
|---|---|---|---|---|---|---|---|
| Residential | ✓ | ✓ | ✓ | ✓ | ✓ | ✓ | ✓ |
| Commercial/Institutional | ✓ | ✓ | ✓ | ✓ | ✓ | ✓ | ✓ |
| Personal Transportation | ✓ | ✓ | ✓ | ✓ | ✓ | ✓ | ✓ |
| Freight Transportation | ✓ | ✓ | ✓ | ✓ | ✓ | ✓ | ✓ |
| Industry | |||||||
| Chemical Products | ✓ | ✓ | ✓ | ✓ | ✓ | ||
| Industrial Minerals | ✓ | ✓ | ✓ | ✓ | ✓ | ||
| Iron and Steel | ✓ | ✓ | ✓ | ||||
| Non-Ferrous Metal Smelting* | ✓ | ✓ | ✓ | ✓ | ✓ | ✓ | |
| Metals & Mineral Mining | ✓ | ✓ | ✓ | ✓ | ✓ | ✓ | |
| Other Manufacturing | ✓ | ✓ | ✓ | ✓ | ✓ | ✓ | ✓ |
| Pulp and Paper | ✓ | ✓ | ✓ | ✓ | ✓ | ||
| Energy Supply | |||||||
| Coal Mining | ✓ | ✓ | ✓ | ✓ | |||
| Electricity Generation | ✓ | ✓ | ✓ | ✓ | ✓ | ✓ | ✓ |
| Natural Gas Extraction | ✓ | ✓ | ✓ | ✓ | ✓ | ✓ | ✓ |
| Pet. Crude Extraction | ✓ | ✓ | ✓ | ✓ | ✓ | ||
| Petroleum Refining | ✓ | ✓ | ✓ | ✓ | ✓ | ✓ | |
| Agriculture & Waste | ✓ | ✓ | ✓ | ✓ | ✓ | ✓ | ✓ |
* Metal smelting includes Aluminium.
Model structure and simulation of capital stock turnover
As a technology vintage model, CIMS tracks the evolution of capital stocks over time through retirements, retrofits, and new purchases, in which consumers and businesses make sequential acquisitions with limited foresight about the future. This is particularly important for understanding the implications of alternative time paths for emissions reductions. The model calculates energy costs (and emissions) for each energy service in the economy, such as heated commercial floor space or person kilometres travelled. In each time period, capital stocks are retired according to an age-dependent function (although retrofit of un-retired stocks is possible if warranted by changing economic conditions), and demand for new stocks grows or declines depending on the initial exogenous forecast of economic output, and then the subsequent interplay of energy supply-demand with the macroeconomic module. A model simulation iterates between energy supply-demand and the macroeconomic module until energy price changes fall below a threshold value, and repeats this convergence procedure in each subsequent five-year period of a complete run.
CIMS simulates the competition of technologies at each energy service node in the economy based on a comparison of their life cycle cost (LCC) and some technology-specific controls, such as a maximum market share limit in the cases where a technology is constrained by physical, technical or regulatory means from capturing all of a market. Instead of basing its simulation of technology choices only on financial costs and social discount rates, CIMS applies a definition of LCC that differs from that of bottom-up analysis by including intangible costs that reflect consumer and business preferences and the implicit discount rates revealed by real-world technology acquisition behaviour.
Equilibrium feedbacks in CIMS
CIMS is an integrated, energy-economy equilibrium model that simulates the interaction of energy supply-demand and the macroeconomic performance of key sectors of the economy, including trade effects. Unlike most computable general equilibrium models, however, the current version of CIMS does not equilibrate government budgets and the markets for employment and investment. Also, its representation of the economy’s inputs and outputs is skewed toward energy supply, energy intensive industries, and key energy end-uses in the residential, commercial/institutional and transportation sectors.
CIMS estimates the effect of a policy by comparing a business-as-usual forecast to one where the policy is added to the simulation. The model solves for the policy effect in two phases in each run period. In the first phase, an energy policy (e.g., ranging from a national emissions price to a technology specific constraint or subsidy, or some combination thereof) is first applied to the final goods and services production side of the economy, where goods and services producers and consumers choose capital stocks based on CIMS’ technological choice functions. Based on this initial run, the model then calculates the demand for electricity, refined petroleum products and primary energy commodities, and calculates their cost of production. If the price of any of these commodities has changed by a threshold amount from the business-as-usual case, then supply and demand are considered to be out of equilibrium, and the model is re-run based on prices calculated from the new costs of production. The model will re-run until a new equilibrium set of energy prices and demands is reached. Figure 26 provides a schematic of this process. For this project, while the quantities produced of all energy commodities were set endogenously using demand and supply balancing, endogenous pricing was used only for electricity and refined petroleum products; natural gas, crude oil and coal prices remained at exogenously forecast levels (described later in this section), since Canada is assumed to be a price-taker for these fuels.
FIGURE 26: CIMS ENERGY SUPPLY AND DEMAND FLOW MODEL
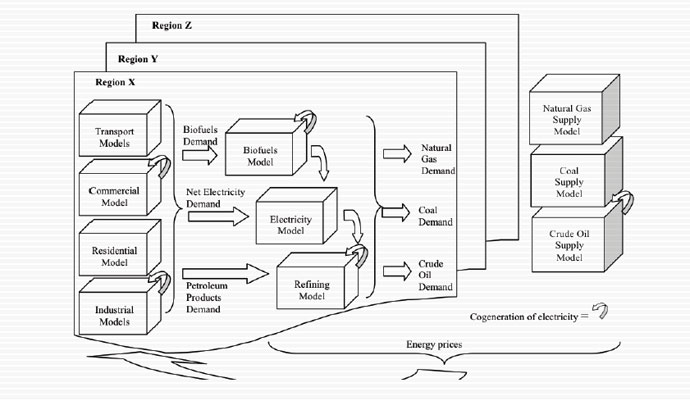
In the second phase, once a new set of energy prices and demands under policy has been found, the model measures how the cost of producing traded goods and services has changed given the new energy prices and other effects of the policy. For internationally traded goods, such as lumber and passenger vehicles, CIMS adjusts demand using price elasticities that provide a long-run demand response that blends domestic and international demand for these goods (the “Armington” specification).u Freight transportation is driven by changes in the combined value added of the industrial sectors, while personal transportation is adjusted using a personal kilometres-travelled elasticity (-0.02). Residential and commercial floor space is adjusted by a sequential substitution of home energy consumption vs. other goods (0.5), consumption vs. savings (1.29) and goods vs. leisure (0.82). If demand for any good or service has shifted more than a threshold amount, supply and demand are considered to be out of balance and the model re-runs using these new demands. The model continues re-running until both energy and goods and services supply and demand come into balance, and repeats this balancing procedure in each subsequent five-year period of a complete run.
Empirical basis of parameter values
Technical and market literature provide the conventional bottom-up data on the costs and energy efficiency of new technologies. Because there are few detailed surveys of the annual energy consumption of the individual capital stocks tracked by the model (especially smaller units), these must be estimated from surveys at different levels of technological detail and by calibrating the model’s simulated energy consumption to real-world aggregate data for a base year.
Fuel-based GHGs emissions are calculated directly from CIMS’ estimates of fuel consumption and the GHG coefficient of the fuel type. Process-based GHGs emissions are estimated based on technological performance or chemical stoichiometric proportions. CIMS tracks the emissions of all types of GHGs, and reports these emissions in terms of carbon dioxide equivalents.v
Both process-based and fuel-based CAC emissions are estimated in CIMS. Emissions factors come from the U.S. Environmental Protection Agency’s FIRE 6.23 and AP-42 databases, the MOBIL 6 database, calculations based on Canada’s National Pollutant Release Inventory, emissions data from Transport Canada, and the California Air Resources Board.
Estimation of behavioural parameters is through a combination of literature review and judgment, supplemented with the use of discrete choice surveys for estimating models whose parameters can be transposed into CIMS behavioural parameters.
Simulating endogenous technological change with CIMS
CIMS includes two functions for simulating endogenous change in individual technologies’ characteristics in response to policy: a declining capital cost function and a declining intangible cost function. The declining capital cost function links a technology’s financial cost in future periods to its cumulative production, reflecting economies-of-learning and scale (e.g., the observed decline in the cost of wind turbines as their global cumulative production has risen). The declining capital cost function is composed of two additive components: one that captures Canadian cumulative production and one that captures global cumulative production. The declining intangible cost function links the intangible costs of a technology in a given period with its market share in the previous period, reflecting improved availability of information and decreased perceptions of risk as new technologies become increasingly integrated into the wider economy (e.g., the “champion effect” in markets for new technologies); if a popular and well respected community member adopts a new technology, the rest of the community becomes more likely to adopt the technology.
Methodology to categorize abatement cost of existing and proposed policies
To categorize the abatement cost of existing and proposed policies, we compare their abatement in 2020 with that induced by carbon pricing. Using the method described below, we categorize abatement as occurring in one of three thresholds:
Rplow= low cost reduction ($0-50/t CO2e)
Rpmed= medium cost reduction ($51-100/t CO2e)
Rphigh= high cost reduction (>$100/t CO2e)
Assuming the following simulations,
Rp = reductions in 2020 from all existing and proposed policies
R50 = reductions from $50/t CO2e alone (constant price from 2005)
R100 = reductions from $100/t CO2e alone (constant price from 2005)
Rp+50 = reductions from all policies plus $50/t CO2e
Rp+100 = reductions from all policies plus $100/t CO2e
Reductions from all policies are categorized as follows:
Rplow = reductions from existing policy in low-cost category
= Rp – (Rp+50 – R50)
Rpmed = reductions from existing policy in medium-cost category
= Rp – (Rp+100 – R100) – Rplow
Rphigh = reductions from existing policy in high-cost category
= Rp+100 – R100
Methodology to quantify abatement gaps
A similar approach was taken to quantify the gap between expected emissions in 2020 and the federal target for emission reductions.
Gplow = low cost gap ($0-50/t CO2e)
Gpmed = medium cost gap ($51-100/t CO2e)
Gphigh = high cost gap ($101-150/t CO2e)
Assuming the following simulations,
Rp = reductions in 2020 from all existing and proposed policies
Rp+50Gap = reductions from all policies plus $50/t CO2e from 2015 to 2020
Rp+100Gap = reductions from all policies plus $100/t CO2e from 2015 to 2020
Rp+150Gap = reductions from all policies plus $150/t CO2e from 2015 to 2020, the price required to achieve 607 Mt CO2e in 2020.
The gap is characterized as follows:
Gplow = potential reductions to close gap in low-cost category
= Rp+50Gap – Rp
Gpmed = potential reductions to close gap in medium-cost category
= Rp+100Gap – Rp+50Gap – Rp
Gphigh = potential reductions to close gap in high-cost category
= Rp+150Gap – Rp+100Gap – Rp+50Gap – Rp
7.3 Summary of climate policies included in the analysis
| Existing | Proposed | Excluded from modelling because under 1 Mt CO2e or not possible to model | Excluded from modelling because policy not defined in sufficient detail | |
|---|---|---|---|---|
| Federal |
|
|
|
|
| BC |
|
|
|
|
| AB |
|
|
|
|
| SK |
|
|
|
|
| MB |
|
|
|
|
| ON |
|
|
|
|
| QU |
|
|
|
|
| NB |
|
|
||
| NS |
|
|||
| NL |
|
|
|
|
| PE |
|
|
|
|
| YK |
|
|||
| NT |
|
|||
| NV |
|
7.4 Federal policy summary
The federal government is implementing a sector-by-sector regulatory approach to drive emission reductions through the establishment of sectoral emissions performance standards. In addition, the government is developing performance requirements for various products, which are referred to as product performance standards.
Emissions performance standards
The first sector targeted under the current federal sector-by-sector regulatory approach is the electricity sector. The electricity sector contributed 120 Mt CO2e to Canada’s total emissions, or 16%, in 2008. Within that sector, coal-fired electricity generation was responsible for 93 Mt of GHG emissions, or over three quarters, of the emissions.75 The Government of Canada is pursuing regulations for coal-fired electricity generation through the Reduction of Carbon Dioxide Emissions from Coal-Fired Generation of Electricity Regulations (Coal-Fired Regulations).76
Under the proposed regulation, an emissions performance standard has been established for new coal-fired units and coal-fired units past the end of their “useful life.” This standard is designed so that the emissions released are equivalent to those from high-efficiency natural gas electricity generation.77 It is expected that the regulation will encourage a transition from current coal-fired electricity to more efficient and renewable sources. The final regulations are expected to come into effect in 2015. These regulations are expected to reduce 175 Mt CO2e cumulatively between 2015 and 2030.78 Annual reductions will ramp up over time.
The electricity mix varies significantly between provinces. These regulations will primarily impact Alberta, Saskatchewan, Nova Scotia and New Brunswick where coal is currently a major electricity source. In contrast, provinces which greatly rely on hydro power such as British Columbia, Manitoba, Québec and Newfoundland and Labrador will be virtually unaffected by the Coal-Fired Regulations. Ontario will also not be affected by these federal regulations because its coal phase-out is expected to have eradicated coal-fired electricity generation by 2014.79
Separate sector-specific regulations are anticipated for all other major emissions sources80, including for the upstream oil and gas industry. The quantity of emissions being driven through the Coal-Fired Regulations suggest that planned reductions from other sector-specific regulations could also play an important role in driving future emissions reductions in Canada.
Product Performance Standards
Vehicle emissions are a key source in Canada, with passenger cars and light trucks accounting for 12% of total emissions in 2007. The Passenger Automobile and Light Truck Greenhouse Gas Emission Regulations prescribe mandatory GHG emission standards for vehicles produced in 2011 and later years, with the stringency of the emission standards increasing over time. The regulations are designed to require manufacturers to meet a set emissions standard across the entire fleet, and they provide flexibility through banking and trading emission credits over time and across manufacturers. Environment Canada anticipates that as a result of these regulations, vehicles from model years 2011 to 2016 will, over their lifetime, yield 92 Mt of GHG reductions.81
Heavy-duty vehicles contributed just over 6% of Canada’s GHG emissions in 2009.82 The federal government is developing Heavy Duty Vehicles Regulations to regulate emissions from this source consistent with U.S. regulations. The proposed regulations would apply to vehicle manufacturers. A vehicle-based emission standard would incent emission reductions from engines and other components of the vehicle. As is the case with light-duty vehicles, emission standards would increase over time, starting with the model year 2014. Compliance flexibility could be offered through banking and trading emission credits. Examples of vehicles to be covered under these regulations include full-size pick-up trucks, tractor-trailers, cement trucks, and buses.83
The Renewable Fuels Regulations were established to mandate fuel producers and importers to ensure gasoline contain an average of at least 5% renewable fuels. The regulations provide compliance flexibility through trading credits across regulatees. The government anticipates that this regulation will drive an incremental GHG emission reduction of approximately 1 Mt per year. These regulations took effect on December 15, 2010.84 A later amendment to these regulations requires 2% renewable content in diesel fuel and heating oil, coming into force on July 1, 2011.85
7.5 Overlapping federal and provincial climate change policies
Case 1: A federal emission performance standard overlaps with a provincial quantity measurew
Overlap does not present any difficulty if the provincial regulation is stringent enough that the federal regulation is non-binding. However, if the federal regulation is binding, additional reductions required from covered firms will mean that other firms do not need to reduce as much as they would have done (instead, they would purchase additional credits from the firm subject to the overlapping regulation). Overall emissions in the regulated sectors are unchanged but the addition of the federal standard produces additional cost.
Case 2: A federal emission performance standard overlaps with a provincial price measurex
this case, overlap does not create problems. If the provincial regulation is stringent enough then the federal regulation is non-binding. If the federal standard is binding, total emissions in the province will fall.
Case 3: A federal product performance standard overlaps with any provincial policy
Overlap does not present any difficulty if the federal regulation is stringent enough that the provincial regulation is non-binding. If the provincial policy is binding, it will cause increased emission reductions from regulated emitters but also yield unintended consequences that may be problematic. Regulated entities within the province will reduce their emissions, but others outside the province will be able to expand emissions in response (since the federal product performance standards allow credits to be traded between firms). Ultimately, overall emissions are unchanged, the burden of emission reduction is shifted to the regulating province, and overall costs of achieving emission reductions increase.
When there is a risk of running up against these unintended consequences of overlapping policies, three strategies can be employed to improve the outcome. First, make additional efforts to coordinate policies between levels of government. Second, rely on price-based policies. They achieve additional reductions even when several policies overlap since they do not result in the unintended consequences described above. Finally, if quantity-based targets are used, consider introducing mechanisms to ensure additionality of reductions when policies overlap.
Source: Wigle and Rivers 2012 (available upon request)
[t] For more information, please visit www.NaviusResearch.com
[u] CIMS’ Armington elasticities are econometrically estimated from 1960–1990 data. If price changes fall outside of these historic ranges, the elasticities offer less certainty.
[v] CIMS uses the 2001 100-year global warming potential estimates from Intergovernmental Panel on Climate Change, 2001, “Climate Change 2001: The Scientific Basis,” Cambridge, UK, Cambridge University Press.
[w] i.e., a market-based measure that restricts total quantity of emissions such as a cap and trade system
[x] i.e., a market-based measure that imposes a financial penalty on emissions such as a carbon tax
[75] Canada Gazette 2011
[76] Canada Gazette 2011
[77] Environment Canada 2011c
[78] Canada Gazette 2011
[79] Government of Ontario 2010
[80] Canada Gazette 2011
[81] Canada Gazette 2010a
[82] Environment Canada 2011b
[83] Environment Canada 2010b
[84] Canada Gazette 2010b
[85] Environment Canada 2011e