


Chapter 4: Target 2020
Reality Check: The State of Climate Progress in Canada


Is Canada on track to meet its 2020 GHG targets with federal, provincial, and territorial policies that have been implemented and proposed to date? If not, how much progress has the country made? Which sectors are responsible for driving emission reductions? And how much additional effort is required? The NRT used an economic modelling tool to answer these questions. Our analysis assesses likely contributions of existing and proposed federal, provincial, and territorial climate change polices toward achieving Canada’s 2020 emission-reduction targets.
This chapter provides an overview of our modelling approach and results. We begin by outlining the model itself and scenarios used to estimate emission reductions to 2020 from climate policies. Next, we present national forecast results and assess these likely reductions in the context of the federal 2020 target. We then provide a regional assessment, exploring the provincial distribution of forecasted emission reductions and progress toward each province’s own targets as a continuation of our assessment of provincial plans from Chapter 3. Finally, we describe emission reductions from existing and proposed policies in terms of sector-level impacts. To offer a deeper picture of Canadian climate policy we also forecast emission reductions to 2030 and consider how far along Canada is to meeting another 2020 target it set for itself: renewable energy generation.
4.1 Analytical approach
The NRT used the CIMS model to forecast the impacts of GHG mitigation policies to 2020. This section provides an overview of the modelling methodology and approach.f
Strengths of the CIMS model
CIMS is an economic modelling tool that simulates the evolution of the Canadian economy under a variety of energy and environmental policy regimes. The model is based on detailed representation of technologies that use and produce energy. To generate a forecast, it simulates firm and household choices as these technological stocks are replaced over time. The model also includes equilibrium feedbacks, such that supply and demand for energy-intensive goods and services adjust in response to policy. Based on this representation of Canada’s energy economy, CIMS can project the effects of government policies and programs on the energy-economy system, estimating how subsidies, regulations, and market-based policies influence technological development, firm and household decision making, demand for energy products, and resulting GHG emissions.
The model covers about 98% of Canadian GHG emissions apart from deforestation and land-use changes. It explicitly represents residential, commercial, personal, and freight transportation; industry; energy supply; agriculture; and waste sectors of the economy, with additional resolution for various sub-sectors. The model is disaggregated by province, although the Atlantic Provinces are grouped together. For this report, the NRT conducted supplementary analysis to separate Atlantic forecasts by province based on supporting data from Environment Canada and assumptions about the electricity sectors in each province.g Emissions from the territories were not disaggregated explicitly in the modelling analysis because they are very small overall but are included in the national-level results. The regional and sector-level resolution allows for modelling a range of provincial/territorial as well as federal policies that apply either to specific sectors or to the economy as a whole.
Further, because the model is fully integrated, it also represents the interactions and overlaps between these different policies. Representing these interactions ensures that the model does not double-count emission reductions from different policies.
CIMS is a well-established modelling tool. It has been used by various provincial/territorial governments in Canada including British Columbia, Alberta, Saskatchewan, Ontario, the Northwest Territories, and Newfoundland and Labrador. It has also been used in a range of national-level analyses through organizations including Natural Resources Canada, the International Institute for Sustainable Development, and the NRT. As a result of these analyses, the model has continued to be improved through time. CIMS’ track record for policy analysis in Canada establishes the model as a credible tool for analysis.
Finally, for the analysis in this report, the NRT applied CIMS using a transparent, credible modelling process. The baseline for the CIMS forecast was Environment Canada’s assumptions for growth in each sector. Energy prices were drawn from the National Energy Board’s 2011 Energy Futures report.69 We presented the analysis to Environment Canada officials and also engaged with provincial and territorial government representatives on the modelling results at the NRT’s Canadian Climate Policies Dialogue. Model results were also peer reviewed. The NRT adjusted and improved the forecasts throughout the modelling process in response to feedback.
Limitations of economic modelling
All model forecasts are inherently uncertain and should not be considered precise predictors of the future. The Canadian energy-economy system is complex, as are the effects of policy on this system. To simulate this system, the analysis depends on assumptions about technological and economic development, energy prices, and firm and consumer behaviour. The model uses credible sources to guide these inputs, but no amount of research allows perfect foresight into the future of the economy.
Yet uncertainty in the forecasts does not preclude the usefulness of models. Forecasts can provide a directional indication of the likely impacts of policy and can be very useful in comparing relative impacts of different policy tools. The goal of economic modelling is not to produce a forecast for its own sake, but to draw insight and learning from forecasts and scenarios. This is the approach the NRT takes in this analysis. Overall, the NRT therefore remains confident in the modelling results presented here. The directional impacts of the modelling analysis in chapters 4-5 provide useful and important policy insight. To ensure the analysis is as useful as possible, we are transparent about the assumptions and limitations of the analysis. Appendix 7.2 provides additional detail on the CIMS model and the methodologies applied in this report.
Defining scenarios
The scenarios modelled define the sets of federal, provincial, and territorial policies we explored within the modelling analysis. We assessed the likely impacts of three different sets of policies:
- Existing provincial and territorial policies are measures to reduce GHG emissions that provincial or territorial governments implemented after 2005.
- Existing federal policies are measures to reduce GHG emissions that the federal governments implemented after 2005.
- Proposed federal, provincial, and territorial policies are measures to reduce GHG emissions that have been proposed by any level of government for implementation by 2020 but have not yet implemented. We included policies for which enough detail has been made public that reasonable modelling assumptions can be made as to the nature of the measures.
We estimate the expected incremental emission reductions from each of these sets of policies to 2020 by layering the policies in sequential scenarios. The difference in forecasted GHGs between scenarios with and without a set of policies illustrates the incremental impact of that set of policies. To do this, we started with a No Policy case that assumes no new government measures had been implemented after 2005. This gives us a clear baseline upon which to measure the effectiveness to date and likely success of all federal and provincial/territorial policies implemented and proposed.
We then added to this scenario the Existing Provincial and Territorial Policies scenario to assess the incremental emission reductions expected from these policies. Next, the Existing Federal Policies scenario estimates the incremental emission reductions from federal policies implemented since 2005, in addition to existing provincial/territorial polices. Finally, the Proposed Policies scenario estimates the incremental emission reductions from policies from all levels of government — federal, provincial, and territorial — that have been announced but not yet implemented or legislated.
Table 6 provides an overview of federal, provincial, and territorial policies included in the modelling. For more details about specific policies included in the analysis, see Appendix 7.3.
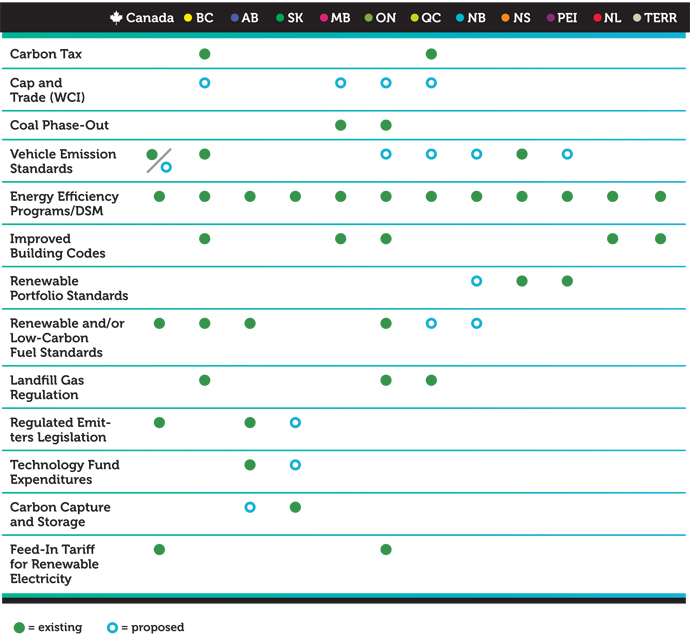
The NRT assessed all provincial, territorial, and federal policies and endeavoured to include as many individual policies as possible in the modelling analysis. We worked with representatives from the federal and provincial governments to ensure all major policies from each jurisdiction were included in the modelling. To manage the scope and complexity of the analysis, the NRT excluded some policies from the modelling based on qualitative assessment. Policies not modelled were either 1) likely to result in less than 1 Mt CO2e of emission reduction annually or 2) had insufficient detail available to represent their likely impacts using CIMS.h In the case of the latter, some policies were still being defined by policy makers, while others are information-based or voluntary programs that do not translate well to the CIMS modelling framework. The NRT, however, qualitatively assessed the government measures not explicitly included in the modelling to assess how they might contribute additional emission reductions by 2020 to be as comprehensive as possible in our assessment (see Text Box 4).
4.2 The emissions gap
Canada has a stated emission reductions target for 2020 of 17% below 2005 levels. To achieve our target, Canadian emissions must drop to 607 Mt CO2e in 2020. As seen in earlier chapters, the federal, provincial, and territorial governments have all implemented climate plans and policies to drive emission reductions in Canada. This section adds up the national emissions trajectory to 2020 based on these actions. It assesses how much progress Canada has made in meeting the 2020 target and how much of an emissions gap likely still remains.
Effects of existing provincial/territorial policies
To assess the impact of existing provincial and territorial policies, GHG forecasts are compared under two scenarios. The differences in emissions or abatement between the No Policy scenario — which includes no new policies since 2005 — and the Existing Provincial and Territorial scenario reflect the impact of this set of policies. Figure 8 below illustrates the forecasted emission reductions.
FIGURE 8: EMISSION REDUCTIONS FROM EXISTING PROVINCIAL/TERRITORIAL POLICIES
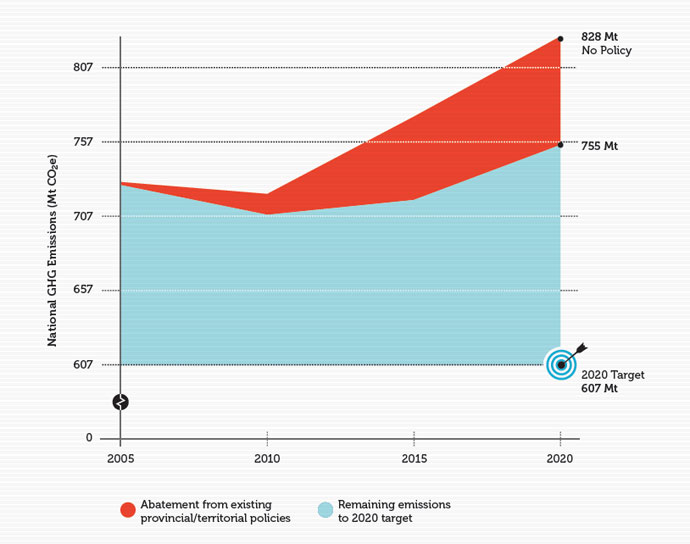
As illustrated in the figure, the No Policy scenario forecasts that Canada’s emissions would have risen to 828 Mt CO2e by 2020. This trend would have placed Canada about 221 Mt CO2e above its target in 2020. Existing P/T policies implemented since 2005 put Canada on the path toward significant progress in closing the gap to the target, leading to an expected 73 Mt CO2e of emissions reduction in 2020.
Effects of existing federal policies
Now we present the effects of existing federal policies. Figure 9 illustrates the incremental abatement existing federal policies, notably including regulations for vehicles and coal-fired electricity, would add to reductions from existing P/T policies, by layering these additional policies onto the previous scenarios.
FIGURE 9: EMISSION REDUCTIONS FROM EXISTING PROVINCIAL/TERRITORIAL AND FEDERAL POLICIES
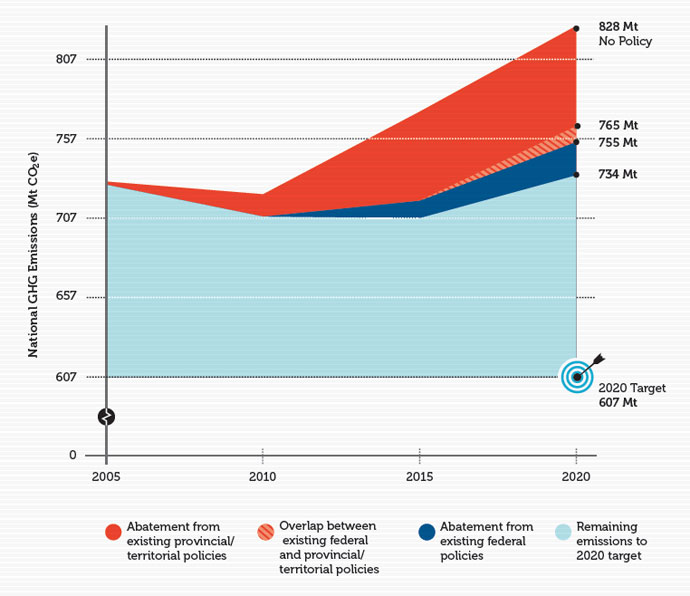
As illustrated, federal polices will result in 21 Mt CO2e of incremental emissions reduction by 2020, less than one-third of reductions from P/T policies. Together, however, emission reductions from both federal and P/T existing policies amount to 94 Mt CO2e of expected emission reductions in 2020. Our forecast suggests an emissions gap to the Canadian target of about 127 Mt CO2e based only on existing policies.
Emissions are not actually “federal” or “provincial.” Some overlap between existing federal and existing P/T policies will exist as policies chase some of the same emissions. Policies with areas of overlap include the federal electricity regulations and the coal phase-out in Ontario as well as energy efficiency and demand-side programs for energy-use in buildings from both levels of government. To avoid double-counting of abatement, Figure 9 illustrates this overlap in efforts that amount to about 10 Mt CO2e of emission reductions in 2020. Existing federal policies layered on top of P/T policies achieve an incremental 21 Mt CO2e of emission reductions. If existing federal policies were modelled on their own, they would achieve 31 Mt CO2e of emission reductions in 2020. The NRT followed Environment Canada’s standard modelling practice in how it conducted its scenario modelling.
Effects of proposed federal and provincial/territorial policies
Both the federal and P/T governments have announced their intent to move forward with additional policies to reduce emissions. Our final scenario explores the potential impact of these proposed policies on GHGs to 2020 to determine if they could further close the emissions gap to the 2020 target. Even though these policies have not been implemented at the time of this report, governments have clearly stated their intention to move forward with them and have provided sufficient detail to define their nature. Figure 10 shows the incremental emission reductions from these proposed federal and P/T policies.
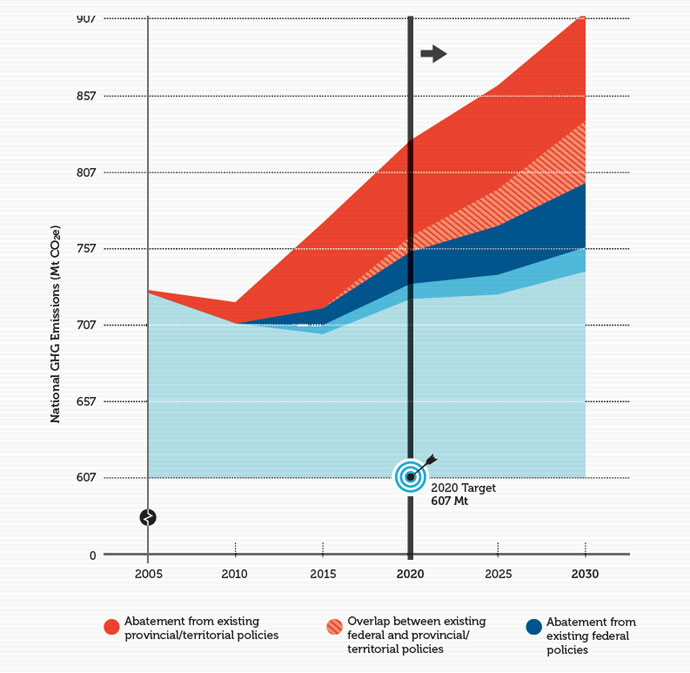
FIGURE 10: EMISSION REDUCTIONS UNDER EXISTING AND PROPOSED FEDERAL, PROVINCIAL, TERRITORIAL POLICIES

The proposed policies scenario would likely result in an additional 10 Mt CO2e of reductions by 2020, about 10% more abatement than currently expected. These additional emission reductions are relatively small partly because existing policies have already driven substantial reductions and make up most of the effort by governments, but also because only a few policies likely to make a substantial impact have actually been proposed. Federal regulations for emissions on heavy vehicles will have an impact across the country. A proposed cap-and-trade policy under the Western Climate Initiative in British Columbia, Ontario, Manitoba, and Québec will also help reduce emissions, but the stringency of the cap is essentially the same as the existing carbon tax in British Columbia, so it has no incremental impact in British Columbia. Overall, the forecast suggests that together, the proposed policies will likely have only small impacts and will be insufficient to close the gap to the 2020 target. Should governments not go ahead and implement these policies then even fewer emission reductions will occur as can be seen below in our uncertainty analysis.
The remaining gap to 2020
The NRT forecasts presented above suggest that existing and proposed federal, provincial, and territorial polices will together lead to substantial emission reductions of 104 Mt CO2e in 2020. However, even considering all these policies, an additional 117 Mt CO2e of emission reductions will be required by 2020 to achieve the target.
A key factor in the explaining this gap is the growth in emissions, largely resulting from growth in the Canadian economy, and in particular, in emissions-intensive sectors such as oil and gas. As Figure 10 shows, all sets of policies have an increasing impact through time — the coloured wedges of emission reductions grow wider and wider. Consequently, the gap to the target continually narrows to 2015, before again widening between 2015 and 2020, as growth in emissions from emissions-intensive sectors begins to again outpace emission reductions induced by policy. Still, existing and proposed policies provide a foundation for achieving Canada’s 2020 emissions goal. Our analysis suggests that almost half the required reductions are likely to be achieved through existing and proposed government measures.
Uncertainty in the remaining gap
Exploring potential uncertainty in our assessment can be useful to illustrate how different assumptions can lead to different estimates for remaining emissions to the 2020 target. In the core analysis presented above, we have generally assumed that new policies will be implemented as stated and old policies remain in effect. We consider both an optimistic and a pessimistic scenario to better indicate the possible range of the size of the remaining gap.
Text Box 4: Government policies not represented in the modelling
GOVERNMENT POLICIES
|
Based on these filters, several additional policies emerge as potentially important contributors to overall Canadian emission reductions, as illustrated in the table below. In most cases, the estimate is an upper bound estimate derived from government claims that have not been independently verified or assessed in context. Therefore we assume that these estimates present an optimistic assessment of emission-reduction potential. In total, we estimate incremental emissions abatement from these remaining quantifiable policies of up to 2.3 Mt CO2e in 2020. |
||||||||||||||||||||||||||||||||||||||||||||||||||||||||||||
|
|||||||||||||||||||||||||||||||||||||||||||||||||||||||||||||
 Canada
Our optimistic case includes some additional possible sources of emission reductions. First, as noted, the modelling analysis includes all major government policies and programs, but excludes government measures likely to have small impacts or that have insufficient detail available for modelling. The NRT’s qualitative assessment of these policies, however, suggests that they could lead to up to 2.3 additional Mt CO2e of emission reductions in 2020 (See Text Box 4 for details of this qualitative analysis). Second, the core analysis described above does not include the effects of investments under the Climate Change and Emissions Management Corporation (CCEMC) in Alberta. As discussed in Text Box 5, this mechanism could lead to up to an additional 6 Mt CO2e of reductions in 2020. Under this optimistic scenario, the remaining gap in 2020 to the Canadian target would be 109 Mt CO2e, rather than 117 Mt CO2e; Canada would be slightly more than 50% of the way to achieving the target.
Yet proposed policies may not be implemented and existing policies may be weakened or cancelled. We considered a pessimistic case in which we assumed the following:
- All proposed policies (the Western Climate Initiative, CCS projects in Alberta,i proposed regulations industrial regulations in Saskatchewan, federal heavy duty freight truck regulations) do not move forward;
- Federal Electricity Performance Standards, which are not yet finalized, are not implemented; and
- Ontario coal phase-out, which has been delayed in the past, does not proceed beyond what has already occurred to date.
Under this pessimistic scenario, national abatement would be reduced by about 32 Mt CO2e in 2020, and the remaining gap in 2020 to the Canadian target would be 149 Mt CO2e instead of 117 Mt CO2e. Instead of being halfway to the target in 2020, Canada would be about one-third of the way there.
Many sources of uncertainty exist when forecasting future impacts of policies. The extent to which existing and proposed policies will close the gap to the 2020 target depends on factors such as economic and population growth, prices of natural gas and other energy sources, and technological change.
| Scenario | Gap (Mt CO2e) |
|---|---|
| NRT Forecast | 117 Mt |
| Optimistic Scenario | 109 Mt |
| Pessimistic Scenario | 149 Mt |
Text Box 5: Emission reductions from Technology Fund expenditures
EMISSION
|
Consequently, the NRT implemented additional, complementary analysis to assess the likely reductions. We first drew on CIMS forecast data to identify the share of emitters’ compliance achieved through offsets or direct emission reductions. We could then identify remaining compliance as contributions to the technology fund and so assess the revenue the CCEMC would be likely to generate from compliance payments by 2020. We then — drawing on assumptions generated from engagement with Alberta provincial government officials about the typical projects funded and typical project timelines — estimated the likely additional emissions by 2020. This analysis also accounted for additionality effects (i.e., the extent to which projects would have been developed even without CCEMC funding support). The analysis is likely optimistic, but does provide an assessment of additional potential emission reductions in Alberta. |
This analysis suggests that CCEMC will receive around $1.8 billion between 2011 and 2020 through contributions to the technology fund, and this could lead to up to an additional 6 Mt CO2e of reductions in 2020 in Alberta beyond the reductions shown in the figures in this chapter. This estimate is separate from the main analysis presented in this report because it is generated using a different methodology, and the sectors in which these reductions occur are not known. However, these reductions would further serve to reduce the expected emissions gap to the 2020 target. Applying a similar analysis for the proposed Technology Fund in Saskatchewan indicates that no additional emissions would result because the Fund would not generate any revenue. Given that our forecast shows that Saskatchewan is likely to achieve its 2020 emission-reduction target, firms will not have significant compliance obligations under the policy, and so will not need to purchase credits from the Fund. If the Fund does not generate revenue, it cannot invest in low-carbon activities. |
A key element of Alberta’s Specified Gas Emitters policy is the Technology Fund administered by the Climate Change and Emissions Management Corporation (CCEMC). One compliance option for industrial emitters is to contribute to this fund. The CCEMC then invests these funds in projects to reduce GHG emissions elsewhere in the province. Saskatchewan’s proposed policy for industrial emitters will include a similar mechanism.
While the NRT’s modelling does represent the incentive the Specified Gas Emitters policy provides for firms to reduce emissions (to avoid contributing to the technology fund), modelling the likely effects of CCEMC expenditures is challenging. The specific projects in which the CCEMC will invest is uncertain, as is the timing of these investments and the extent to which the funding from CCEMC is the key driver for the project. The CIMS model is not equipped to represent the possible effects of these expenditures on GHGs.
Consequently, the NRT implemented additional, complementary analysis to assess the likely reductions. We first drew on CIMS forecast data to identify the share of emitters’ compliance achieved through offsets or direct emission reductions. We could then identify remaining compliance as contributions to the technology fund and so assess the revenue the CCEMC would be likely to generate from compliance payments by 2020. We then — drawing on assumptions generated from engagement with Alberta provincial government officials about the typical projects funded and typical project timelines — estimated the likely additional emissions by 2020. This analysis also accounted for additionality effects (i.e., the extent to which projects would have been developed even without CCEMC funding support). The analysis is likely optimistic, but does provide an assessment of additional potential emission reductions in Alberta.
This analysis suggests that CCEMC will receive around $1.8 billion between 2011 and 2020 through contributions to the technology fund, and this could lead to up to an additional 6 Mt CO2e of reductions in 2020 in Alberta beyond the reductions shown in the figures in this chapter. This estimate is separate from the main analysis presented in this report because it is generated using a different methodology, and the sectors in which these reductions occur are not known. However, these reductions would further serve to reduce the expected emissions gap to the 2020 target.
Applying a similar analysis for the proposed Technology Fund in Saskatchewan indicates that no additional emissions would result because the Fund would not generate any revenue. Given that our forecast shows that Saskatchewan is likely to achieve its 2020 emission-reduction target, firms will not have significant compliance obligations under the policy, and so will not need to purchase credits from the Fund. If the Fund does not generate revenue, it cannot invest in low-carbon activities.
4.3 A regional perspective
Given the importance of provincial and territorial policies in driving Canada’s emission reductions, what is the regional story behind 2020 emission reductions? To what extent are provinces likely to achieve their own targets? How are emission reductions from both provincial and federal policies distributed across Canada? This section explores these questions and builds upon our assessment of provincial plans from chapter 3.
Provincial/territorial targets
As noted in Chapter 3, if all provinces and territories achieved their own 2020 targets, federal policies would only need to achieve about an additional 41 Mt CO2e of emission reductions to reach the national 2020 target. The fact that no formal federal/provincial burden-sharing protocol on GHG emissions reductions has ever been negotiated helps explain why Canada has difficulty assessing progress toward individual provincial targets and continues to have a 2020 gap.
Figure 11 situates the provincial targets with the model forecasts.j The figures shows 1) 2005 emissions for each province, 2) projected emissions in 2020 if no polices had been implemented after 2005, and 3) the targeted level of emissions under each provincial 2020 target.
FIGURE 11: PROVINCIAL EMISSIONS AND 2020 TARGETS
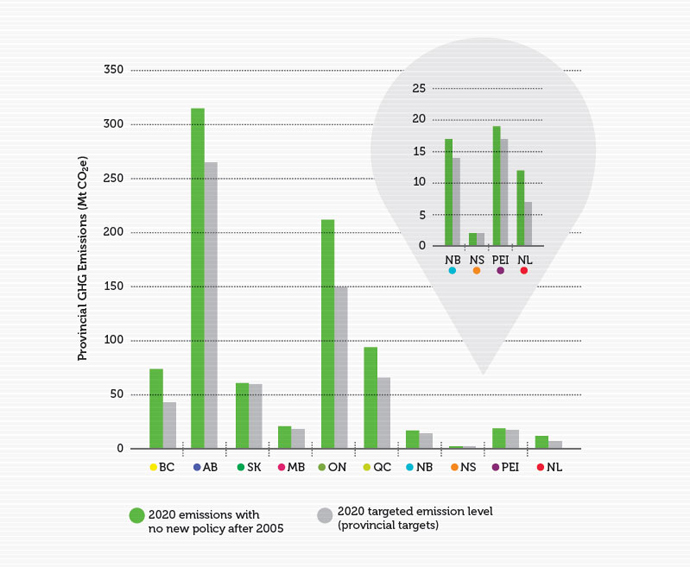
The figure highlights the challenge for each province in the context of both the magnitude of targets and the projected growth of emissions to 2020. Ontario and Québec have deep 2020 targets, for example, while according to the NRT forecast, Saskatchewan, Manitoba,k and Prince Edward Island would likely come close to achieving targets even without policy. On the other hand, even though Alberta’s target actually allows for emission growth relative to 2005 levels, it faces a significant challenge in meeting its target as a result of sharply higher projected emissions growth.
Provincial emission reductions
The set of existing and proposed federal and provincial policies modelled by the NRT will likely have significant impacts on provincial emissions. Figure 12 illustrates the forecasted impacts for each province relative to the No Policy scenario and highlights remaining gaps to provincial targets. This figure illustrates how current and proposed policies reduce each province’s emissions toward their provincial targets. As in our above modelling, the impacts of each policy scenario are incremental to the reductions from the previous scenario.l
FIGURE 12: PROVINCIAL EMISSION REDUCTIONS IN 2020 FROM EXISTING AND PROPOSED FEDERAL AND PROVINCIAL POLICIES
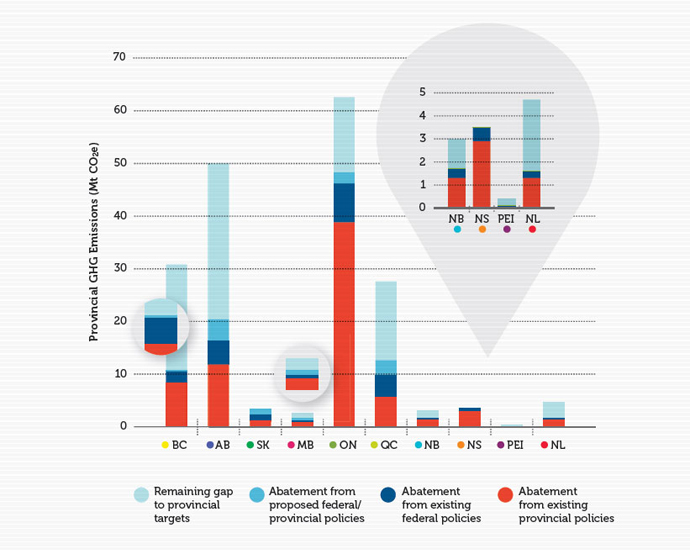
As illustrated in the national forecast scenarios, existing provincial policies drive the largest share of expected emission reductions in each province. Policies like British Columbia’s carbon tax, Alberta’s Specified Gas Emitter program,m the coal-fired electricity phase-out in Ontario, and Nova Scotia’s renewable electricity sector policies all help reduce emissions. The model allocates overlaps between existing federal policies and existing provincial policies to the provinces to avoid double counting. This means that existing federal policies like the coal-fired electricity standard have reduced incremental impact in the provincial results shown here given coal-focused policies by Ontario and Nova Scotia.
Expected abatement from proposed federal and provincial policies meanwhile is distributed across Canada but mostly in Alberta, Saskatchewan, Ontario, and Québec. The most substantial impact of proposed policies occurs in Alberta as a result of carbon capture and storage (CCS) project proposals. The forecast suggests these projects could lead to around 5 Mt CO2e of reductions in 2020.
Characteristic 4: Environmental effectiveness
As described in Chapter 3, our fourth key element of an effective provincial climate change plan is the inclusion of sufficient measures to achieve the GHG reduction targets established. The NRT forecast illustrated in Figure 12 shows that Nova Scotia and Saskatchewann are the only provinces expected to achieve their 2020 targets under the current set of existing and proposed policies. Existing and proposed policies for Ontario, Manitoba and New Brunswick are expected to bring these provinces more than 50% of the way to closing the gap and achieving targeted emission reductions in 2020. For the remaining provinces, existing and proposed policies are expected to make less than 50% of the progress necessary to close the gap and achieve targeted emission reductions by 2020.
It is important to emphasize that these conclusions are based on the forecast gap between 2020 emissions in the No Policy scenario and the 2020 emissions target (as set out in Figure 11) and the extent to which the policies modelled in the NRT analysis are expected to close that gap in 2020 (as set out in Figure 12).Table 8 situates progress for each province toward meeting its own GHG target based on this assessment.
 BC BC |
 AB AB |
 SK SK |
 MB MB |
 ON ON |
 QC QC |
 NB NB |
 NS NS |
 PEI PEI |
 NL NL |
|---|---|---|---|---|---|---|---|---|---|
| 35% | 41% | 100% | 62% | 77% | 46% | 56% | 100% | 30% | 35% |
4.4 A sector-level perspective
Our sector-level story of emission reductions under proposed and existing policies further describes the nature of the impacts of federal and P/T policies. It not only illustrates the primary focus of emission reductions from government policies, but also highlights where additional emission reductions might be found.
Sector-level reductions
The policies in the three scenarios modelled include measures that affect multiple sectors and those that affect emissions only in a single sector. Some provincial policies are more market-based like the British Columbia carbon tax, the proposed WCI cap-and-trade system, and to a lesser extent, the Québec gas levy. Others are regulatory in nature with compliance options and focused on large emitters, such as Alberta’s existing and Saskatchewan’s proposed industrial emitter regulations. Finally, some policies are more sector-based such as the federal light- and heavy-vehicle regulations and coal-fired electricity generation, or landfill gas regulations in Ontario, Québec, and British Columbia, and building codes in multiple provinces and territories.
FIGURE 13: EMISSION REDUCTIONS FROM EXISTING AND PROPOSED POLICIES BY SECTOR IN 2020
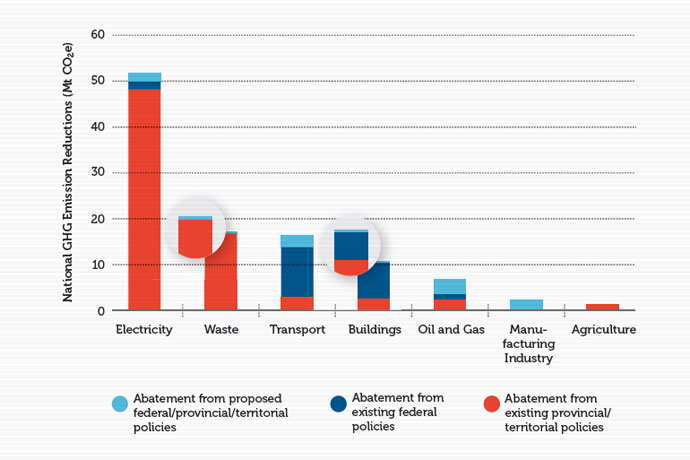
Figure 13 shows expected reductions from existing and proposed polices by sector.o It demonstrates that electricity generation is the largest source of emission reductions with 48 Mt CO2e in 2020, principally because of existing provincial policies. Many provinces have targeted electricity generation directly as a key source of emissions: Ontario is phasing out coal plants, Prince Edward Island has a renewable portfolio standard and incentives for wind power, Nova Scotia has a cap on electricity-sector emissions, and British Columbia has a zero-emissions electricity objective. A focus on electricity makes sense since it is a high-emitting sector and reducing the carbon intensity of electricity supply can enable fuel switching to electricity to reduce emissions associated with consuming energy. Note that the overlap between federal and provincial policies is not illustrated here; overlap is allocated to provincial policies to avoid double-counting. Consequently, the incremental impacts of the federal coal-fired electricity standards are small because provincial policies such as the Ontario coal phase-out have already incented some of these emission reductions.
Waste is another sector that will see substantial expected emission reductions — about 17 Mt CO2e in 2020 — as a result of provincial regulations and policies for landfill gas emissions. As we will explore in Chapter 5, capturing methane emissions is often a relatively low-cost source of emission reductions.
Finally, the forecast suggests that federal light-vehicle standards will have a substantial impact, with saving of close to 11 Mt CO2e of emissions in 2020 in the transportation sector under existing policies. The proposed heavy-duty freight transport regulations have a relatively small forecasted impact of about 3 Mt CO2e.
Key remaining sector-level emissions
The emission reductions from the policies modelled also look quite different in the context of total emissions in the sector. Figure 14 stacks the estimated emission reductions from all existing and proposed policies set out in Figure 13 on top of all emissions from that sector, and compares them to 2005 emission levels. The figure therefore illustrates forecasted progress toward reducing emissions in each sector.
FIGURE 14: SECTOR-LEVEL EMISSION REDUCTIONS AND REMAINING EMISSIONS UNDER EXISTING AND PROPOSED POLICIES IN 2020
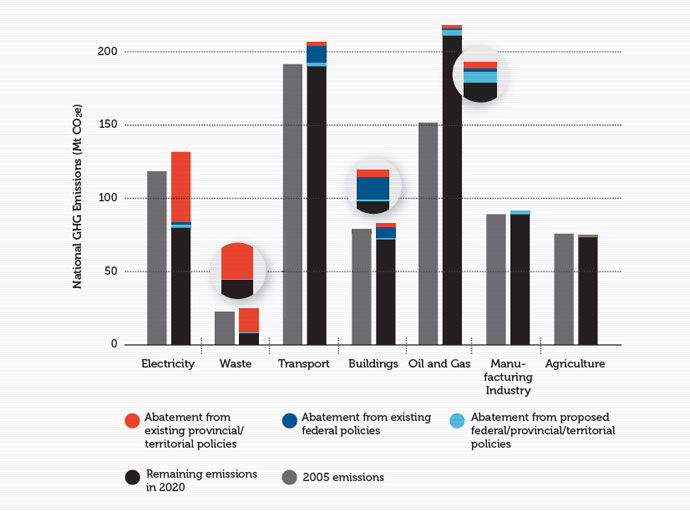
The forecast suggests that current and proposed policies will reduce emissions to 2005 levels or further in all sectors but oil and gas. This demonstrates the centrality of reducing emissions in this sector in order to achieve the 2020 target. Emissions in the waste sector are reduced by almost 70% from 2005 levels and electricity generation by 39%. While transportation policies are expected to drive some substantial emission reductions from forecasted growth, this same growth in the sector keeps overall emissions from dropping below 2005 levels. In Chapter 6, we will explore the costs of achieving further emission reductions in each sector.
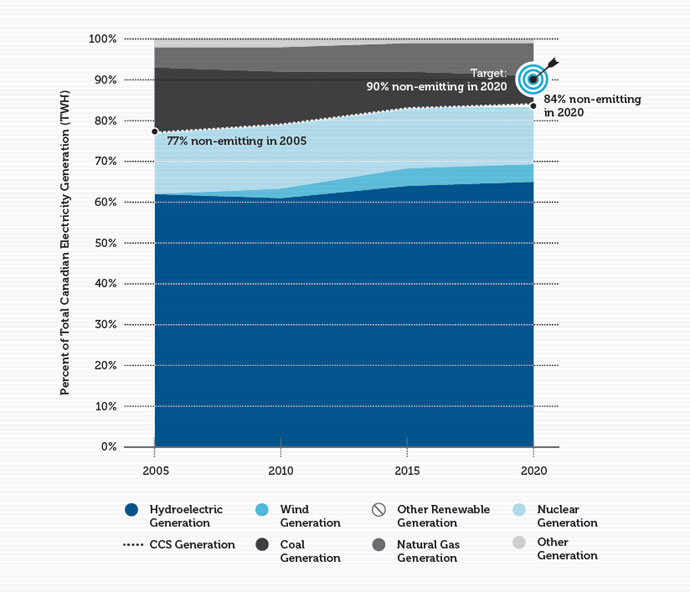
Canada’s target for low-emissions electricity generation
The federal government also has a stated target of 90% of electricity generated from non-emitting sources by 2020.70 The NRT’s modelling assesses Canada’s progress toward this goal. Figure 15 illustrates Canada’s projected electricity mix under a scenario including all existing and proposed policies from federal, provincial, and territorial policies. It shows that the country will increase its non-emitting electricity share from 77% in 2005 to 84% in 2020. By 2020, hydroelectricity, wind, and other renewable generation are likely to make up about 69% of Canadian electricity generation. If nuclear generation and fossil-fuel-generated electricity equipped with CCS is included in this mix, Canada is projected to have about 84% carbon-emissions-free electricity by 2020. Canada is not on track to achieve this 90% target but is positioned to make progress.
FIGURE 15: CANADIAN ELECTRICITY GENERATION BY TYPE, 2005–2020 (INCLUDING THE EFFECTS OF ALL EXISTING AND PROPOSED POLICIES).
4.5 Emission reductions to 2030
Even though the main focus of this report is on Canadian emissions to 2020, the longer-term story cannot be ignored. Cumulative GHG emissions matter for climate change. While short-term targets like 2020 are important in themselves, they are most significant as waypoints on a path toward long-term decarbonization. If Canada is not on a path for 2020, it will not be on path for 2030 or beyond. We therefore consider the likely impacts of existing and proposed policy in the longer term as well. Figure 16 shows the expected emission reductions under the different policy scenarios in our forecasts extended out to 2030.
The impacts of policies grow through time; by 2030, existing P/T policies are likely to lead to around 110 Mt CO2e of reductions (including overlap with federal polices) from 2005 levels. Existing federal policies add an incremental 42 Mt CO2e of emission reductions in 2030. Overall, the forecast indicates that all existing and proposed policies together will result in emission reductions of 169 Mt CO2e in 2030. Despite this higher amount of reductions Canada is in fact further away from the 2020 target in 2030 due to increased overall growth in emissions.
Many of the policies modelled have greater impacts through time because they affect new investments. More time allows these policies to work with the pace of capital-stock turnover. For example, carbon pricing policies like British Columbia’s carbon tax, Alberta’s Specified Gas Emitter policy or the WCI primarily affect new investment decisions, incenting investment in lower-emissions equipment. Similarly, the federal coal-fired regulations have stronger impacts through time because they affect new plants coming on stream, not existing facilities. The federal vehicle standards also have growing impact as old vehicles are replaced, and only more efficient new vehicles are available in the market to replace them.
FIGURE 16: EMISSION REDUCTIONS UNDER EXISTING AND PROPOSED FEDERAL, PROVINCIAL, AND TERRITORIAL POLICIES TO 2030
4.6 Conclusion
This chapter presents five key findings that are useful for informing future policy development:
- Based on existing and proposed federal and P/T policies, Canada is currently on track to achieve just under half of the emission reductions required to meet its 2020 target. A national emissions gap exists and additional policies will be required to drive further emission reduction in order to achieve the 2020 target.
- Most provinces are not currently in a position to achieve their provincial targets for 2020 based on existing and proposed provincial and federal policies. Our modelling suggests that only Nova Scotia and Saskatchewan are on track to achieve their targets.
- Canada is positioned to close the gap on its target of 90% non-emitting electricity generation in 2020. The NRT’s forecasts suggest that all current and proposed policies have positioned Canada to have close to 84% non-emitting electricity in 2020, including nuclear and fossil-fuel facilities equipped with CCS.
- Reductions from electricity emissions account for most of all projected emission reductions by 2020, followed by waste emission reductions. Most of these reductions are, in turn, incented by provincial policies. Emission reductions incented by federal policies are concentrated in the transport and buildings sectors.
- Policies take time to have full impact. We expect the effects of existing federal and P/T policies to grow, driving 60% more emission reductions in 2030 than in 2020. Federal policies are more effective after 2020 because there is more time for the capital stock to transition to lower-emitting equipment.
[f] The quantitative results in this report are drawn from the consulting analysis prepared for the NRT by Navius Research Inc. This report is available upon request (Navius Research Inc. 2012).
[g] See Navius Research Inc. 2012 for more details.
[h] The NRT has extensive experience in qualitatively assessing the likely impacts of policies through its annual assessment of government forecasts under the Kyoto Protocol Implementation Act.
[i] Carbon capture and storage is an example of a technology that may prove challenging to implement, as evidenced by TransAlta’s recent cancellation of the $1.4 billion Pioneer carbon capture and storage project due to a low price on emissions (O’Meara 2012).
[j] Note that quantitative results for the territories are grouped with British Columbia in this report, but do not significantly affect British Columbia’s results.
[k] The NRT’s analysis of Manitoba assumes a 2020 target of 15% below 2005 levels by 2020, as per Environment Canada 2011a.
[l] To assess policy impacts in the Atlantic Provinces, we disaggregated individual provinces from an aggregate, regional representation in the CIMS model. This breakout was based on Environment Canada data and a detailed look at electricity systems in the four Atlantic Provinces.
[m] Additional reductions could also be expected from Alberta’s Climate Change and Emissions Management Corporation, which is not included in the CIMS modelling shown here, but assessed separately in Box 4.2.
[n] Representatives from the Government of Saskatchewan’s Department of Environment have noted that, in their view, the NRT’s forecast likely underestimates economic growth in Saskatchewan, and thus the extent to which emissions are likely to increase. This concern may be legitimate; recent trends in Saskatchewan have shown rapid growth in Saskatchewan in both population and economic activity. A recent short-term RBC forecast suggests that Saskatchewan could have the highest growth rates of all provinces by 2013 (RBC Economics 2012). However, we did not have alternative, long-term macro-economic assumptions that could be utilized for this modelling. Our forecast is rooted in consistent assumptions about regional and sector-level growth in production drawn from Environment Canada’s modelling, which is in turn based on macro-economic forecasts from Informetrica.
[o] Note that the sectoral breakdown provided here is a function of the CIMS structure and not entirely consistent with the activity-based breakdown used in Canada’s National Inventory Report.
[69] National Energy Board 2011a
[70] Government of Canada 2008