


Chapter 5: Cost-Effective Climate Policy
Reality Check: The State of Climate Progress in Canada


When it comes to climate policy, countries seek the same thing: getting the most GHG emission reductions at the least economic cost. How does Canada fare in this calculus? This chapter ascertains just how cost-effective Canadian climate policies are today and the costs of additional policies needed to close the emissions gap. We begin by estimating the costs of emission reductions expected under existing and proposed measures by governments and then estimate the costs of additional measures that would be needed to close the gap to the 2020 target. To what extent is the existing combination of federal and P/T policies driving low-cost emission reductions? And perhaps more importantly, how can Canada most cost-effectively achieve the additional emission reductions required to close the gap to the 2020 target? By answering these questions, our analysis provides a foundation for advice for future climate policies, informing the Government of Canada’s strategy of sector-by-sector regulations.
5.1 Approach to the economic analysis
The economic analysis in this chapter builds on the previous chapter, which explored expected emission reductions from existing and proposed federal, provincial, and territorial policies and programs in 2020. Figure 17 simplifies the overall emissions forecast into two categories: the expected emission reductions from all existing and proposed federal and P/T policies (about 104 Mt CO2e in 2020) and the additional emissions required to meet Canada’s 2020 target (another 117 Mt CO2e in 2020).
FIGURE 17: NATIONAL EMISSION REDUCTIONS UNDER EXISTING AND PROPOSED FEDERAL, PROVINCIAL, AND TERRITORIAL POLICIES AND GAP TO 2020 TARGET
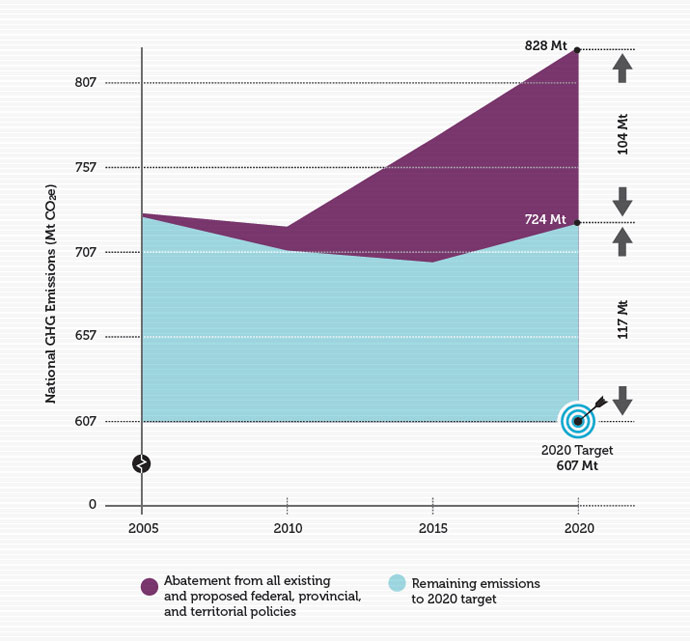
These two sets of 2020 emission reductions — the 104 Mt CO2e Canada is currently positioned to achieve and the 117 additional Mt CO2e required to meet the 2020 target — bookend the economic analysis in this chapter. We first explore the costs of expected emission reductions from existing and proposed policies (that is, the extent to which Canada is on track to achieve the 104 Mt CO2e of emission reductions in 2020 at lowest cost). We then assess the potential for additional policies to meet the remaining 117 Mt CO2e of emission reductions as cost-effectively as possible.
This chapter moves our assessment beyond the environmental effectiveness of existing and proposed policies — how much abatement they achieve — to their cost-effectiveness, or how much of that abatement is at what cost. To do so, we categorize expected emission reductions according to their marginal cost of abatement, or the incremental cost of achieving those additional reductions under the policy in dollars per tonne. See Appendix 7.2 for a short description of the technical modelling methodology used to categorize emission reductions by cost.
This analysis can provide useful insight for policy makers, but the findings must be applied while transparently recognizing its limitations:
- Cost-effectiveness is not the only important factor in policy design. Other key considerations could include co-benefits such as reduced air pollution, health, equity between regions or between households with different income levels, and longer-term transitional issues (i.e., emission reductions targeted in 2050). These other considerations are not the focus of the analysis in this chapter.
- It should be noted as well that the modelling does not provide a perfect representation of the economy. While models can be useful in identifying potential sources of cost-effective emission reductions, the findings presented here do have uncertainty. They are intended to help inform policy design but should not be interpreted as a definitive or prescriptive road map.
5.2 Costs of emission reductions from existing and proposed policies
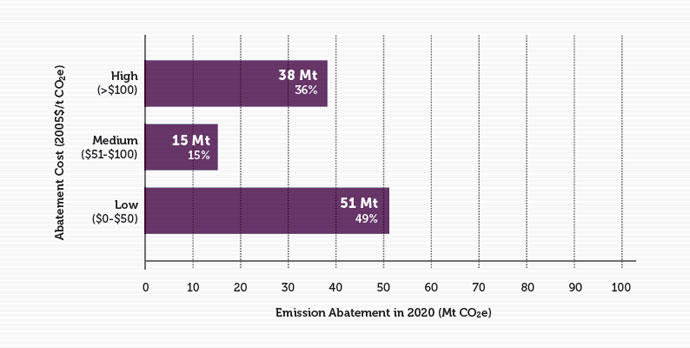
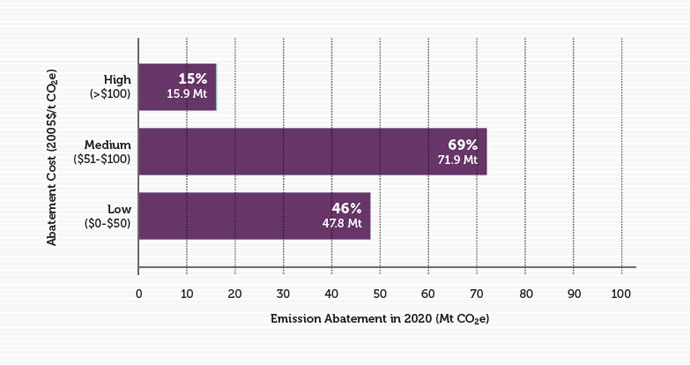
Existing and proposed federal, provincial, and territorial policies have positioned Canada for significant emission reductions of 104 Mt CO2e in 2020. But what are the costs of these expected emission reductions? Figure 18 provides an economic assessment that includes the expected 2020 emission reductions and categorizes them according to abatement cost. We categorize each Mt CO2e of GHG emissions reduced in 2020 as a result of policy as low cost (i.e., less than $50/tonne), medium cost (i.e., between $50 and $100/tonne), or high cost (i.e., more than $100/tonne).p The lengths of each bar indicate the magnitude of emission reductions likely to be achieved in 2020 in each cost range. All the emission reductions shown in Figure 18 add up to the 104 Mt CO2e of reductions from existing and proposed policies in our original analysis; we have simply disaggregated this 104 Mt CO2e of emission reductions by abatement cost.
FIGURE 18: CATEGORIZATION OF EXPECTED NATIONAL EMISSION REDUCTIONS FROM EXISTING AND PROPOSED FPT CLIMATE POLICIES BY ABATEMENT COST IN 2020
Characteristic 5: Cost-effectiveness
As described in Chapter 3, the final element in our assessment of provincial plans is cost-effectiveness. To be clear, an action is cost-effective when it is less expensive than other emission-reduction options. A focus on low-cost emission-reduction opportunities will support the greatest number of reductions at the lowest cost.
First, as seen in Figure 18, almost half the expected emission reductions from existing and proposed policy in 2020 — 51 Mt CO2e — are low-cost emission reductions. Market-based policies such as British Columbia’s carbon tax, Alberta’s specific gas emitter program and the Western Climate Initiative all generate low-cost-abatement. Policies based on market incentives are designed to simulate lowest-cost emission reductions. Similarly, electricity policies that are timed with the natural turnover of capital stock — such as the federal government’s electricity performance standards and some portion of Ontario’s coal phase-out — tend to generate low-cost abatement as well because they don’t require capital investments to shut down before the end of their useful life. Policies in the waste sector (mainly provincial landfill gas regulations) and agriculture sector (included as offsets in Alberta’s Specified Gas Emitter policy) also tend to access low-cost abatement opportunities.
Second, our analysis suggests about 15 Mt CO2e of the reductions in 2020 are valued between $50 and $100 per tonne CO2e, which we have classified as medium-cost reductions. Most medium-cost emission reductions come from the electricity sector and are weighted toward Ontario. The Ontario coal-fired electricity phase-out is therefore likely a significant driver of these reductions, as it accelerates the retirement of some plants ahead of their normal project life.
Finally, our analysis suggests that about 38 Mt CO2e — or just over one-third — of emission reductions in 2020 from existing and proposed policies will be high cost at over $100 per tonne CO2e. These higher cost emission reductions come from a range of sectors across all P/Ts, but have substantial contributions from transportation, building, electricity, and oil and gas sectors in particular. Emission reductions from vehicles — such as those induced by the federal vehicle standard — tend to have high marginal abatement costs overall, because individuals require strong incentives to switch to smaller, more fuel-efficient vehicles or vehicles that use alternative technologies like hybrid or electric engines. Emission reductions in commercial and residential buildings also tend to be largely high cost on a dollar per tonne basis, partly because buildings and appliances tend to become more efficient over time even in the absence of policies, thus reducing the incremental effect of policies implemented across all provinces to increase efficiency. Replacing more carbon-intensive electricity generation with low-carbon sources can have high costs as well, though as discussed below, electricity reductions are spread across all three cost levels. Finally, CCS projects in Alberta and Saskatchewan are estimated to drive both medium- and high-cost reductions, depending on the specific project.
Despite the concentration of low-cost reductions, the pursuit of some high-cost emission reductions suggests that governments have been willing — knowingly or not — in some cases to implement policies that tackle more than just the “low-hanging fruit.”
5.3 Costs of additional emission reductions required to achieve 2020 targets
As discussed in the previous chapter, existing and proposed policies are likely to lead to significant emission reductions, but will only achieve about half the emission reductions required to meet Canada’s 2020 target. Additional government policies are required to incent the remaining 117 Mt CO2e of emission reductions. This analysis assesses the cost implications of closing the gap. Figure 19 shows the costs of the additional 117 Mt CO2e of emission reductions required to meet the 2020 target. Similar to the previous figure, it categorizes these additional emission reductions according to their economic cost of abatement. Our analysis suggests that all emission reductions available in Canada up to $150 per tonne must be achieved to meet the 2020 target.
FIGURE 19: POTENTIAL ADDITIONAL EMISSION REDUCTIONS REQUIRED TO MEET CANADA’S 2020 TARGET (THE "EMISSIONS GAP")
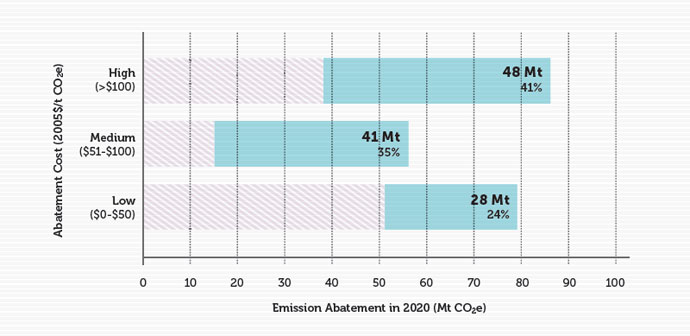
Figure 19 illustrates that about 75% of the gap between expected emissions in 2020 and the federal target for emission reductions can be closed only through medium- or high-cost emission reductions. These reductions are all cost-effective since they are the least expensive way to achieve the 2020 target. Almost 48 Mt CO2e of reductions falls into the “high-cost” classification (which does not exceed $150 per tonne in this case), while about 41 Mt CO2e of medium-cost reductions and 28 Mt CO2e of low-cost reductions are available. The figure suggests that low-cost abatement opportunities are becoming limited in the context of the federal targets in 2020. Essentially, with only eight years to go until 2020, the opportunities for lower-cost abatement in the energy supply and industrial sectors are smaller because firms and households have already made investment decisions that have committed them to a certain level of emissions in 2020.
Figure 20 illustrates the cost profile of Canadian policies necessary to achieve the 2020 target. Effectively, the figure combines Figure 18 and Figure 19, stacking the required additional emission reductions to reach the 2020 target from Figure 19 onto the actual emission reductions expected to result from existing and proposed government polices as presented in Figure 18; again, these are classified as low, medium, or high cost.
FIGURE 20: EMISSION REDUCTIONS IN 2020 FROM EXISTING AND PROPOSED FEDERAL AND P/T POLICES AND THE GAP TO CANADA’S 2020 TARGET
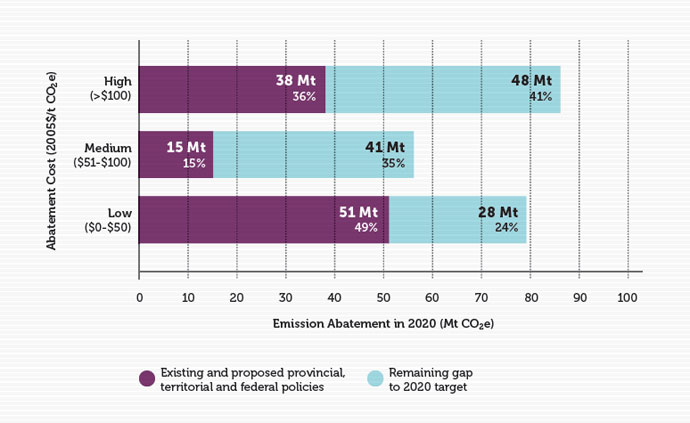
In addition to the reductions expected from existing and proposed policies, additional policies are required to incent emission reductions equal to the remaining emissions gap. To meet Canada’s 2020 target, all the emission reductions in the figure must be achieved. Our analysis shows that additional abatement is available at all cost levels. Though current and existing policies have targeted emissions across the cost spectrum, potential low- and medium-cost reductions still remain that are not yet targeted by any policy. Increasingly, however, Canadian climate policy will have to focus on medium- and high-cost emission reductions if Canada is to achieve its 2020 target.
5.4 Describing additional cost-effective emission reductions
How then should policy seek to achieve the additional cost-effective emission reductions required to meet the 2020 target? The high-, medium-, and low-cost reductions can now be disaggregated by the type of action that leads to reduced emissions by sector and by region to help inform the design of additional policies that federal and P/T governments could implement to incent these emission reductions. Note that the modelling analysis here does not make any assumptions about specific policies as drivers for the emission-reduction actions described. Governments could implement a range of possible policies to induce the cost-effective emission reductions described here. Of most interest is how the analysis could inform the federal government’s sector-by-sector approach to regulation.
The remaining emissions gap disaggregated by action
Actions are the decisions that firms and households take to reduce emissions in response to government policy. For example, they can use energy more efficiently; use alternative fuels that produce fewer emissions (known as fuel switching); reduce production, producing less emissions but also less output; or implement CCS to capture and sequester CO2 emissions. It is important to remember that all emission-reducing actions described here will occur only in response to policy. High-cost abatement actions will result from high-stringency policy by government. Figure 21 shows the low-, medium-, and high-cost components of the 117 Mt CO2e emissions gap, disaggregated by action.
FIGURE 21: COSTS OF EMISSION REDUCTIONS REQUIRED TO CLOSE THE 2020 GAP, DISAGGREGATED BY ACTION
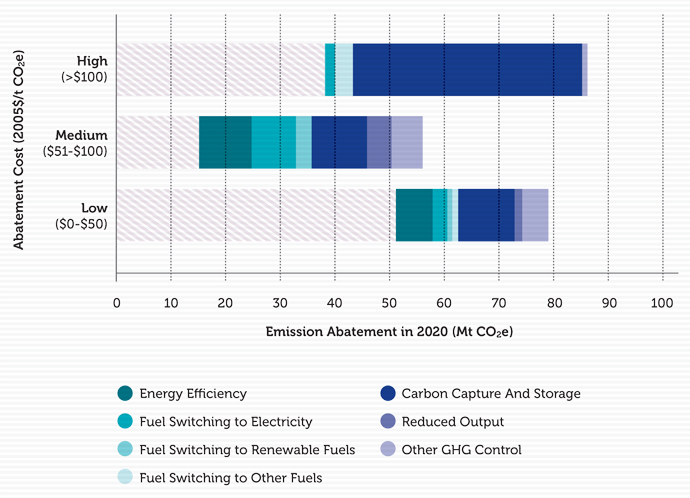
The NRT analysis shows that CCS likely represents a key component of a cost-effective strategy to reduce emissions. In total, we show about 62 Mt CO2e worth of carbon capture in 2020, representing more than 50% of additional emission reductions required, and while costs span a range of abatement costs, the emission reductions mostly occur at a marginal cost of greater than $100 per tonne CO2e (though some lower-cost CCS is available where a pure stream of CO2 can be captured). The CCS-intensive scenario shown here is credible given that in response to sufficiently strong policy signals (like a constant, steady carbon price of $100 to $150 per tonne CO2e, for example) firms would quickly move to implement CCS. The very substantial investment in CCS projects required to achieve these reductions by 2020 would also require an accelerated permitting and construction environment enabled by government along with a clear policy signal about future carbon costs.q
The next most significant action is improving energy efficiency, which accounts for 16 Mt CO2e of reductions in 2020. Potential energy efficiency improvements driving these reductions are concentrated in transport and buildings. However, gains in efficiency are partially offset by the increased energy demand coming from increased deployment of CCS.
Fuel switching to electricity accounts for about 13 Mt CO2e of potential abatement in 2020. Electrification occurs in buildings and light industry at relatively low abatement cost. Some additional electrification is possible in transport, although its potential is constrained by the short time frame to 2020. Over the longer term, electrification is likely to play a much more significant role in cost-effective deep emissions abatement across the economy because equipment can be converted to electricity in pace with natural stock turnover, electric technologies such as heat pumps and batteries can be improved, and the electricity sector can fully decarbonize.
Remaining actions to close the gap include adopting other GHG control measures, fuel switching to renewable fuels, and reducing output. Collectively, these actions account for 21 Mt CO2e of incremental abatement in 2020. Other GHG control measures include instituting changes to industrial processes and minimizing venting and flaring of emissions from the oil and gas sector. These actions are typically possible at low- and medium-cost thresholds.
Finally, we find that some abatement occurs in response to decreased industrial output of key energy-intensive products. Note that we assume that production of crude oil does not vary in response to climate policy. Though many facilities could potentially implement CCS and maintain production, as a result of this assumption the analysis likely underestimates the impacts of reduced output in contributing to a cost-effective approach to achieving 2020 targets.
The remaining emissions gap disaggregated by sector
Exploring potential sector-level emission reductions is also illustrative, particularly given the federal government’s stated intentions to move forward with sector-specific GHG regulations. Figure 22 breaks up the required emission reductions shown in Figure 19 by sector.r Again, the total emission reductions in the figure equal the 117 Mt CO2e required to close the emissions gap. The figure therefore differentiates the low-, medium-, and high-cost emission reductions required to meet Canada’s 2020 target in each sector of the economy.
FIGURE 22: COSTS OF EMISSION REDUCTIONS REQUIRED TO CLOSE THE 2020 GAP, DISAGGREGATED BY SECTOR
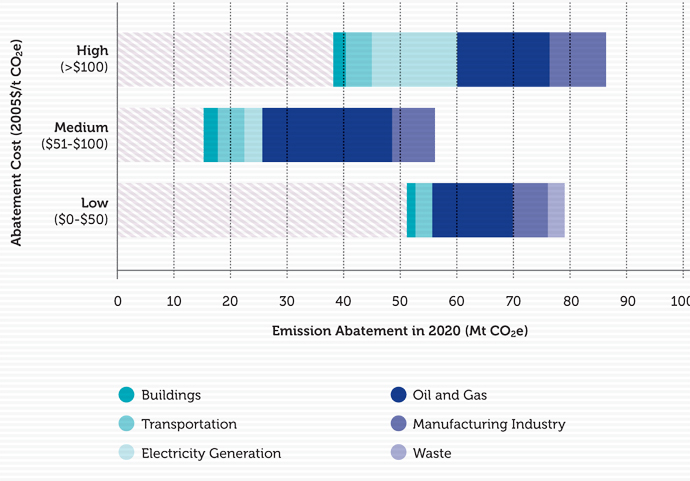
Sectors with larger potential reductions at lower costs should be prioritized, though to meet the 2020 target, all the additional emission reductions shown in Figure 22 must be incented by policy. A few notable findings emerge from the analysis:
First, Figure 22 suggests that almost half the abatement required to close the gap could come from the oil and gas sector, and that most of this abatement could occur from this sector at relatively low and medium costs. This finding lends support to Environment Canada’s consideration for oil and gas regulations as a next step in its sector-by-sector approach to emission reductions. It also makes sense that cost-effective reductions would exist in this sector: since it is poised to grow substantially, new production capacity can be built with lower emitting equipment if the correct policy incentives are in place. Lower-cost abatement actions in the oil and gas sector include energy efficiency improvements, fuel switching to electricity, and some CCS.
Second, some significant potential abatement from manufacturing sectors is likely available at low and medium cost. This potential for low-cost abatement likely exists because existing and proposed federal and P/T policies have not focused extensively on this sector.
Finally, additional potential abatement from electricity generation is also available in 2020 but is mostly high cost. This is due in part to the strong progress made to date in reducing emissions from this sector from low- and medium-cost measures, increasingly leaving higher cost emission reductions on the table. Additional reductions in the electricity sector largely come from retrofitting thermal coal facilities (with CCS mostly in Alberta and Saskatchewan), or shutting these facilities down and replacing them with less emitting sources including renewable energy. To meet the target, demand for electricity will likely increase further as a result of other policies that incent fuel switching away from oil and gas and toward electricity, making it more difficult for the electricity sector to abate over this time period.
The remaining emissions gap disaggregated by region
Figure 23 illustrates that emission reductions are required across all regions and over a range of abatement costs in order to cost-effectively meet Canada’s 2020 target.
FIGURE 23: COSTS OF EMISSION REDUCTIONS REQUIRED TO CLOSE THE 2020 GAP, DISAGGREGATED BY PROVINCE
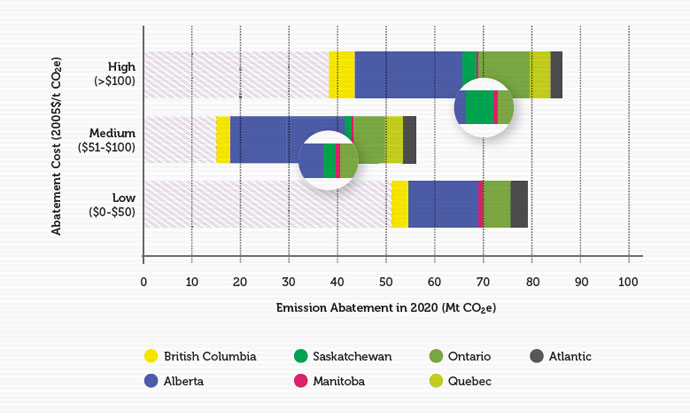
A few specific results are notable. More cost-effective emission reductions are available in Alberta than in any other region, including about 22 Mt CO2e of high-cost reductions, 24 Mt CO2e of medium-cost reductions, and 15 Mt CO2e of low-cost reductions. This finding matches the sector-level results discussed above, since many of the potential reductions in Alberta are in the oil and gas sector. Other provinces that require significant emission reductions are Ontario and British Columbia. British Columbia’s low-cost reductions largely come from the natural gas sector. Ontario has about 6 Mt CO2e of potential low-cost reductions — with a significant share in manufacturing sectors — and another 7 Mt CO2e of potential medium-cost reductions. Almost all provinces have a share of required high-cost emission reductions; a large share of these high-cost potential reductions come from the transportation and building sectors, important in all regions of Canada. Overall, these findings reflect the challenge of the 2020 target: emission reductions must come from multiple sources across Canada, but most must occur in Alberta according to our analysis.
The results highlight the challenges of sharing the burden of national emission reductions across provinces. The distribution of potential emission reductions across Canada illustrated here is an economically efficient one. As noted earlier, to achieve the 2020 target cost-effectively, each province would need to achieve all emission reductions available that cost up to $150 per tonne CO2e. Under this approach, the marginal cost of abatement is effectively equalized across the country with no emission reductions in any province costing more than $150 per tonne CO2e. The total costs of abatement, however, will not be equalized given that provinces like Ontario and especially Alberta will contribute a large absolute share of emission reductions. This greater share of reductions is consistent with the larger total emissions and/or the faster emissions growth in these provinces. Figure 24 illustrates three snapshots of regional emissions. It shows actual emissions in 2005, emissions in 2020 accounting for all existing and proposed policies, and emissions in 2020 assuming that the remaining gap has been cost-effectively filled.
FIGURE 24: PROJECTED PROVINCIAL EMISSIONS
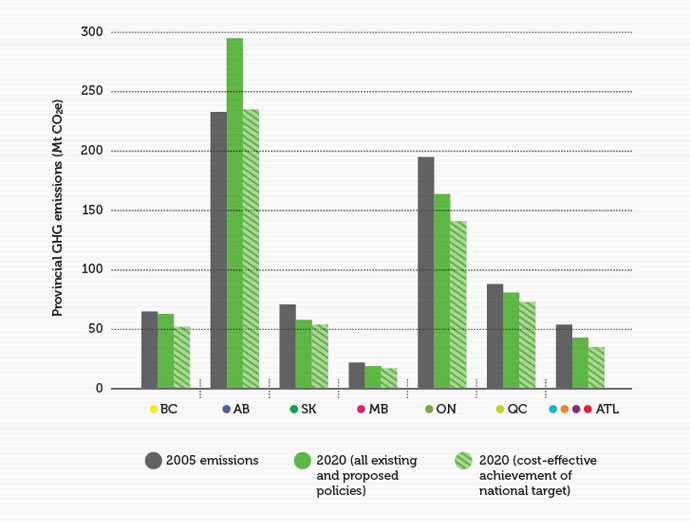
Even though Alberta contributes the largest share of emission reductions in the cost-effective scenario, its emissions still grow by 1% from 2005 levels, whereas all other provinces see decreases between 17% and 36% relative to 2005 levels. Still, the distribution of reductions noted here is illustrative only. While it estimates the least-cost distribution of emission reductions across Canada, these results should not be interpreted as a fully prescriptive recommendation for policy. Burden sharing is complex and must reflect other factors in addition to economic efficiency, such as inter-regional equity considerations. GHG reductions in any one province are not just the responsibility of that province. But it paints the picture with which policy makers must grapple to make progress toward achieving any of our climate goals. Put succinctly, Canada’s target cannot be achieved without emission reductions in Alberta, but Alberta alone cannot achieve Canada’s target.
5.5 The emissions gap in 2030
As noted, one of the main reasons Canada faces mostly high-cost potential abatement is the short period of time available between now and the 2020 target year. Limited time means limited opportunities to make emission reductions that coincide with normal capital stock turnover. Instead, the short time period requires a high level of emission reductions to be achieved by retrofitting or shutting down existing facilities or reducing output. These actions are more expensive than replacing old equipment as it is retired with lower-emitting options. To underline the importance of timing and delay, Figure 25 illustrates the low-, medium-, and high-cost potential emission reductions required for Canada to meet its 2020 target later, by 2030.
FIGURE 25: POTENTIAL ADDITIONAL EMISSION REDUCTIONS REQUIRED TO MEET CANADA’S 2020 TARGET IN 2030
With a longer time period, the nature of the gap changes significantly. First, the overall size of the gap is larger (136 Mt CO2e rather than 117 Mt CO2e), given that emissions continue to grow between 2020 and 2030 even under all existing and proposed policies. Further, much more low- and medium-cost emission reductions are available because the longer time frame allows for reductions to take advantage of natural stock turnover as more emissions-intensive capital is retired and replaced with low-carbon alternatives.
The 2030 analysis has two main policy implications. First, it indicates that more lead time allows for emission reductions to match the normal speed of capital stock turnover, achieving reductions at lower cost. About 30 Mt CO2e less high-cost reductions and about 20 Mt CO2e more low-cost reductions are available to achieve the target over a longer time frame. Second, more time should not be considered a panacea for containing costs. High- and medium-cost reductions can still not be avoided. And delay, of course, results in more cumulative emissions being produced in the meantime. Less lead time to meet the target because of delays in policy action inevitably leads to increased costs of “catching up” to meet the target.
5.6 Conclusion
These findings build on our previous assessment in Chapter 4 of likely emission reductions which concluded that Canada required additional climate action policies if it was to meet the federal 2020 target. This chapter provides insight as to how Canada might close the gap as cost-effectively as possible. It illustrates the sectors and regions in which opportunities for potentially low-cost emission reductions are likely available. Here are the key findings:
- Most importantly, the analysis shows that Canada’s 2020 target is a challenging goal that will require significant and more stringent policies to drive increasingly high cost reductions. A gradual process of trying to capture only the lowest cost emission reductions will not be successful. Yet the analysis also suggests that the target is not yet out of reach. Policies to incent reductions over the full spectrum of costs up to $150 per tonne over all regions and all major sectors could close the gap to 2020.
- A few key sectors, regions, and actions emerge as particularly important contributors to cost-effective emission reductions in 2020. The analysis clearly suggests the oil and gas sector, and Alberta in particular, have a significant role to play. This finding lends credence to Environment Canada’s intention to regulate emissions in this sector. CCS shows as a key contributor to emission reductions in the sector.
- Yet the results also suggest that no one sector, region, or action is a silver bullet for achieving targets. A cost-effective approach to achieving targets requires emission reductions across all sectors and jurisdictions in Canada. This insight highlights a policy gap for Canada that parallels the emissions gap. To achieve all the required least-cost emission reductions, Canada therefore requires either 1) an economy-wide national policy approach or 2) coordination between different levels of government and among different policy mechanisms. Neither approach currently exists in Canada.
- Finally, the analysis also highlights that the short time frame to 2020 is a challenge for Canada. Because 2020 is only eight years away, many of the emission reductions required to meet the target are high-cost reductions. In the context of 2030, for example, substantially more low-cost reductions are available. This finding illustrates the challenge for Canada, but also an important lesson: delays to a coordinated approach with abatement coming from all provinces and all sectors, will only increase the final costs of achieving Canadian climate goals and targets.
[p] All dollar values in this chapter are stated in 2005 Canadian dollars $(2005).
[q] We also explored an alternative scenario that assumed CCS could not be broadly deployed by 2020. With less CCS, the gap to the 2020 target must be filled with much more high-cost abatement from energy efficiency improvements and reduced output. To achieve the 2020 target, abatement with costs up to $300 per tonne must be explored. The core scenario described above, however, with extensive CCS is consistent with Environment Canada’s own modelling analysis of the potential for CCS, based on information exchanged with Environment Canada.
[r] Note that the sectoral breakdown provided here is a function of the CIMS structure and not entirely consistent with the activity-based breakdown used in Canada’s National Inventory Report.