


Chapter 2: Canada’s Emissions Story
Reality Check: The State of Climate Progress in Canada


2.1 History of federal climate policy
The Government of Canada has been engaged on the climate file for over two decades. In 1988, at “The Changing Atmosphere: Implications for Global Security” conference in Toronto, the Progressive Conservative government of Prime Minister Brian Mulroney committed Canada to reducing its GHG emissions 20% by 2005.1 This target was altered later that year at a meeting of the G7 countries where Prime Minister Mulroney made a commitment to stabilize national GHG emissions at 1990 levels by the year 2000.2 Two years later, the federal government introduced a Green Plan that contained $175 million for 24 GHG reduction policies mostly focused on energy efficiency and alternative energy. This plan came with a revised target to stabilize GHG emissions at 1990 levels by 2000. This was a non-binding target that Canada also embraced in the Framework Convention on Climate Change in 1992.3
In 1993, Prime Minister Jean Chrétien proposed the same GHG emission-reduction target that was committed to at The Changing Atmosphere conference in 1988 of 20% below 1988 levels by 2005.4 In 1995, the federal government launched the National Action Program on Climate Change, which focused on information programs and small subsidies. The federal government estimated that this program would reduce GHG emissions by 66 megatonnes carbon-dioxide equivalent (Mt CO2e) by 2010.5 The main elements in the program were the Voluntary Challenge and Registry, asking for a voluntary submission of GHG emission-reduction plans and regular progress reports by companies; the Federal Buildings Initiative, supporting federal government building retrofits with higher energy efficiency standards; and the National Communication Program, a climate change education program for Canadians.6
In the five years leading up to the signing of the Kyoto Protocol, Canada went through multi-stakeholder consultations on emission reductions. There was agreement among the federal and provincial ministers of environment and energy (with the exception of Québec which sought a more ambitious target) that Canada’s position would match the U.S.’s commitment to reduce emissions to 1990 levels by 2010. Although this target was agreed upon in the opening days of the Kyoto meeting, the federal government unilaterally announced that Canada would reduce its emissions to 6% below 1990 levels by 2010. After signing the Kyoto Protocol, in 1998 (before ratifying in 2002) the federal government released its Action Plan 2000 on Climate Change. This plan set in place subsidies for renewable energy alongside consumer/business energy information programs.
| Year Target was Set | Target | Base Year Emissions (Mt CO2e) | Projected Emissions Target (Mt CO2e) |
|---|---|---|---|
| 1988 | 20% below 1988 levels by 2005 | 588* | 470 in 2005* |
| 1990 | Remain at 1990 levels by 2000 | 590 | 590 in 2000 |
| 1993 | 20% below 1988 levels by 2005 | 588* | 470 in 2005* |
| 1995 | 66Mt below 1995 levels by 2010 | 640 | 574 in 2010 |
| 1998 | 49Mt below 1998 levels by 2010 | 677 | 628 in 2010 |
| 2002 | 6% below 1990 levels by 20127 | 590 | 555 in 2012 |
| 2007 | 20% below 2006 levels by 20208 | 719 | 575 in 2020 |
| 2010 | 17% below 2005 levels by 20209 | 731 | 607 in 2020 |
* This is an approximate number based on data in Environment Canada 1999 and NRT calculations
In the last decade, three unique climate approaches have been taken by the federal government, which can be described, respectively, as the Kyoto approach, the Turning the Corner approach, and the Copenhagen approach. Each approach is marked by differing emissions reduction targets and measures to achieve these targets (see Table 1).
The Kyoto approach
In 2002, Canada ratified the Kyoto Protocol it had signed in 1998 committing to reduce GHG emissions by 6% from 1990 levels by 2012.10 At that time Canada’s emissions had climbed from 1990 levels of 590 Mt to 717 Mt.
In 2000, the federal government began to outline steps to achieve the Kyoto target, including a federal commitment of $1.1 billion to incent GHG emission-reduction measures over a five-year period.11 This plan was supplemented in 2002 with a Climate Change Plan for Canada that committed to establishing GHG reduction targets for large industry; providing flexible compliance through trading and other measures; co-funding emission reductions with provinces, municipalities, and others; and undertaking additional targeted measures.12 In 2005, under Project Green, the government confirmed its intent to regulate large final emitters and provide compliance flexibility through emissions trading, offsets, and a technology fund.13
The Turning the Corner approach
In 2006 the new Conservative federal government led by Prime Minister Stephen Harper announced that Canada was not on track to meet its Kyoto obligations.14 Subsequently, in 2007, a new GHG reduction target of 20% below 2006 levels by 2020 was announced.15 Canada’s emissions had peaked around that same time at about 750 Mt, some 27% higher than 1990 levels.16
To meet the new target, the government introduced Turning the Corner, a domestic air emissions management plan with emissions intensity as the base measurement for emission reductions. Turning the Corner proposed the regulation of industrial emitters in a cap-and-trade system that would provide compliance flexibility through trading, offsets, and a technology fund, as part of a broader regulatory program aimed at reducing GHG and air pollution emissions.
The Copenhagen approach
In 2010, as a signatory to the Copenhagen Accord, Canada announced a new target of 17% reduction from 2005 levels by 2020, aligning with the United States’ target.17 This would yield roughly 30 Mt CO2e fewer emission reductions per year by 2020 than the Turning the Corner plan. Emissions in Canada had meanwhile been declining at this point in time from 748 Mt CO2e in 2007 to 690 Mt CO2e in 2009, principally because of reduced economic growth and higher energy prices.18
To achieve this target, a new “sector-by-sector regulatory approach” was initiated. The centerpiece of the regulatory regime is a set of emissions performance standards starting with regulations for the electricity sector. In addition to the sector-by-sector approach, the government is also developing performance requirements for various products, which are referred to as product performance standards. Appendix 7.4 provides more information on the federal approach.19
Key issues
Despite a shift in targets and approaches over time, the Government of Canada remained a signatory to the Kyoto Protocol until the end of 2011, when the government announced its intention to withdraw on the grounds that the Protocol did not include the majority of global emitters and that the costs of compliance would be excessive without yielding environmental benefits.20 Since 2007, the Kyoto Protocol Implementation Act has required the Government of Canada to provide an annual report on progress toward achieving the Kyoto commitment and created statutory obligations for the NRT to provide an assessment of these annual plans. The NRT’s 2011 assessment report supported the government’s own analysis indicating that Canada would exceed its Kyoto target by about 161 Mt CO2e per year during the compliance period.21
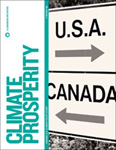
Issues of international competitiveness — particularly with the U.S. — have been an important factor in developing Canadian climate policy as the NRT pointed out in Parallel Paths: Canada–U.S. Climate Policy Choices. In 2009 the government began to place more focus on working with the U.S. to achieve clean energy and climate change goals, primarily through co-operation on clean energy research and development and enhancing the electricity grid in ways that favour increased use of clean energy.22 However, working closely with the U.S. on this file is a challenge given both the lack of a comprehensive U.S. plan to confront climate change and the important role that sub-national jurisdictions are playing on both sides of the border.b Canada has moved away from plans to implement a trading system for large emitters and has instead focused on harmonizing regulations and standards with those of the U.S. wherever feasible, as in the case of fuel economy standards.
2.2 History of provincial climate action
The federal and provincial governments share jurisdiction over environmental matters under the Constitution of Canada (see Text box 1). This offers both benefits and challenges, which are discussed in the next chapter. As Canada worked to develop policies to manage climate change in the late 1990s and early 2000s, the federal and provincial governments initially sought a joint approach. This proved to be challenging, with widely divergent natural resource endowments yielding differing total and per capita GHG emissions and leading to differing economic interests with respect to climate policy. The choice of target under the Kyoto Protocol and the manner in which it was decided, together with the ensuing U.S. withdrawal, also proved divisive, with a number of provinces opposing Canadian ratification at the time. Once the federal government made the decision to ratify Kyoto, attempts at joint federal/provincial action on climate change basically dissipated and have not been formally resurrected.23
Following several years of federal policy uncertainty, provinces began to act more unilaterally in the mid-2000s. As the report discusses in Chapter 3 and in Appendix 7.6, the provinces are currently implementing a number of actions to address GHG emissions both independently and in co-operation with other provinces and some U.S. states.
Text box 1: Jurisdiction over environmental considerations
JURISDICTION OVER
|
However, the Constitution also allows for federal power over climate change policy in Canada, based on peace, order, and good government, or regulation of trade and commerce powers.24 The extra-provincial, interprovincial, transcontinental and international nature of the challenge further points to a federal role. In addition, climate change can be viewed as a matter of national concern because addressing it requires one national law that can be met with flexible provincial action but cannot be satisfied by co-operative provincial action because the failure of one province to co-operate would carry with it adverse | consequences for the residents of other provinces.25 In circumstances when there is conflict over jurisdictional authority, co-operation is a possible remedy. Tools for inter-jurisdictional co-operation include “memoranda of understanding to establish mutually supportive objectives, equivalency agreements which allow one jurisdiction’s laws (usually the federal government) to be withdrawn from application if there are equivalent provisions at the other level (usually provincial), and express incorporation by reference of another jurisdiction’s legislation.” 26 |
The Constitution of Canada entrenches authority over land and natural resources with the provinces. This gives provinces the power to determine the pace and scale of resource exploitation, receive royalties and rents and by extension, strong influence over the actual GHG emissions resulting from this development. However, the Constitution also allows for federal power over climate change policy in Canada, based on peace, order, and good government, or regulation of trade and commerce powers.24 The extra-provincial, interprovincial, transcontinental and international nature of the challenge further points to a federal role. In addition, climate change can be viewed as a matter of national concern because addressing it requires one national law that can be met with flexible provincial action but cannot be satisfied by co-operative provincial action because the failure of one province to co-operate would carry with it adverse consequences for the residents of other provinces.25
In circumstances when there is conflict over jurisdictional authority, co-operation is a possible remedy. Tools for inter-jurisdictional co-operation include “memoranda of understanding to establish mutually supportive objectives, equivalency agreements which allow one jurisdiction’s laws (usually the federal government) to be withdrawn from application if there are equivalent provisions at the other level (usually provincial), and express incorporation by reference of another jurisdiction’s legislation.”26
2.3 Emissions trends (1990–2009)
Figure 1 shows Canada’s emissions trends since 1990 with federal climate policies overlaid. Emissions trends over time reflect a combination of forces including resource use, environmental policy, and economic trends. While Canada’s emissions increased 17% between 1990 and 2009, a 6% reduction occurred between 2005 and 2009. The year 2005 is a useful benchmark as many provincial measures have been introduced since that time; 2005 now marks the baseline for measuring Canada’s progress.
FIGURE 1: TIMELINE OF FEDERAL APPROACHES TO CLIMATE CHANGE AND EMISSIONS TRENDS
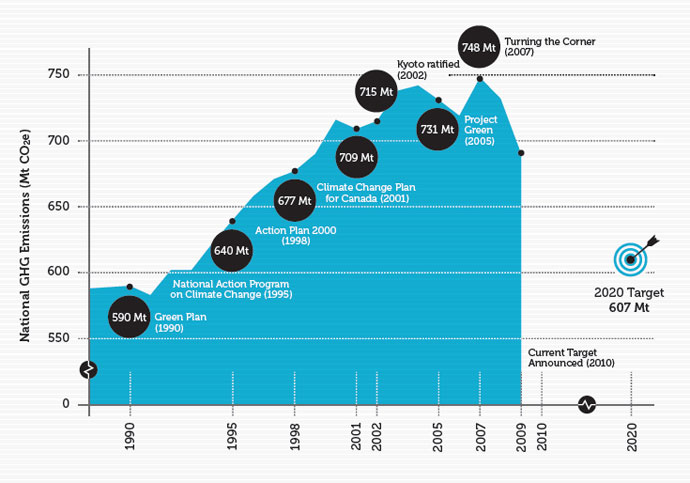
Source: Data taken from Environment Canada 2011b
Figure 2 demonstrates the connection between economic development and Canada’s GHG emissions. Over the last two decades, our overall emissions have risen as has our GDP, but the emissions intensity of our economic output has fallen dramatically.
FIGURE 2: ECONOMIC GROWTH AND GHG INTENSITY OF ECONOMY (1990–2009)
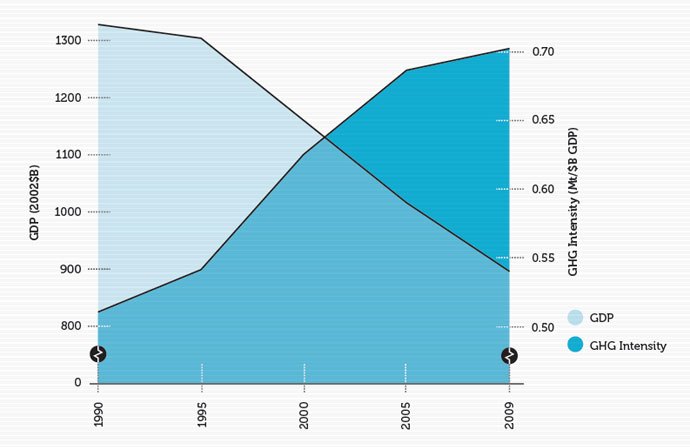
Source: Inputted data taken from Environment Canada 2011b; and Statistics Canada ND
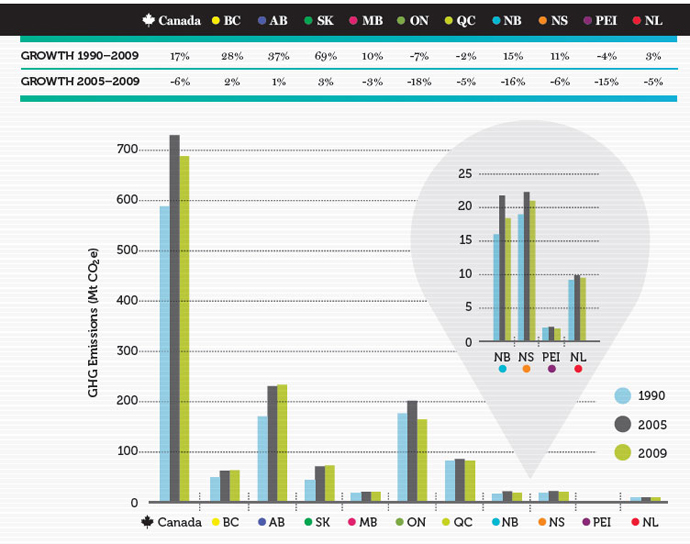
Figure 3 disaggregates emissions trends at the provincial level, indicating changes in emissions over time since 1990 and 2005. As shown, the most rapid growth in emissions over the last two decades occurred in Saskatchewan and Alberta. In contrast, Ontario, Québec, and Prince Edward Island have seen emissions fall over that period. In the 2005 to 2009 period, all provinces to the east of Saskatchewan along with British Columbia show overall reductions while Alberta and Saskatchewan reported very limited emissions growth. These recent trends can be explained by the economic downturn and the ramp-up of provincial GHG mitigation policies.
FIGURE 3: EMISSIONS TRENDS (1990–2009)
Source: Inputted data taken from Environment Canada 2011b
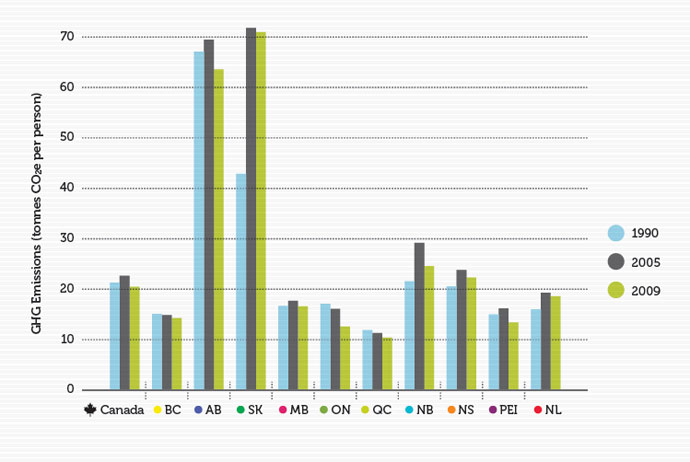
On a per capita basis, there has been a slight downward trend for Canada overall since 1990, though the evolution is markedly different across provinces as shown in Figure 4.
FIGURE 4: PER CAPITA EMISSIONS TRENDS (1990–2009)
Source: Data taken from Environment Canada 2011b
In Chapter 4 of this report, we build from these historical trends to forecast future emissions to 2020 based on existing and proposed policies at the federal and provincial levels to assess the extent to which Canada is on track to achieve its 2020 target.
2.4 Emissions sources by province/territory
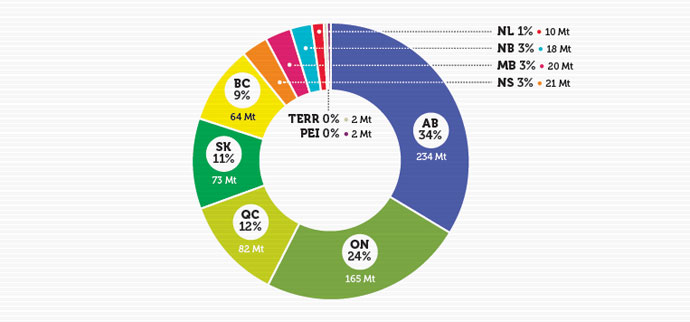
Emissions vary significantly across the country, driven by diversity in population size, economic activities, and resource base among other factors. For example, regions where the economy is oriented more toward resource extraction will tend to have higher emission levels whereas more service-based economies tend to have lower emissions levels. Also, the key electricity generation sources vary across the country with provinces that rely on fossil fuels for their electricity generation having higher emissions than provinces that rely more on hydroelectricity. Figure 5 shows the provincial/territorial distribution of 2009 emissions across the country in absolute terms as well as the share this represents of total Canadian emissions.
FIGURE 5: PROVINCIAL/TERRITORIAL CONTRIBUTION TO CANADA’S TOTAL EMISSIONS IN 2009
Source: Data taken from Environment Canada 2011b
On an absolute basis, the majority of emissions (58%) originate from just two provinces — Alberta and Ontario. Alberta has the highest number of GHG emissions because it is the largest energy producer in the country. In 2009, stationary combustion energy sources represented 56% of the province’s emissions. Within that, electricity and heat generation accounted for 48 Mt CO2e, fossil fuel production and refining emitted 36 Mt CO2e, and mining and oil and gas extraction emitted 23 Mt CO2e.27 Ontario is the second-highest emitter because of its population size, energy consumption, and sizeable transportation emissions. Transportation accounted for 58 Mt CO2e, and manufacturing industries contributed 16 Mt CO2e, followed closely by electricity and heat generation with 15 Mt CO2e.28
Figure 4 shows that, in per capita terms, Saskatchewan and Alberta have the highest emissions levels. Saskatchewan’s per capita emissions are high due to a small population and high stationary combustion and agriculture emissions. In Alberta, Saskatchewan, New Brunswick, and Nova Scotia, relatively high per capita emissions can be explained in part because of reliance on coal for electricity generation.
2.5 Emissions sources by activity
Under the United National Framework Convention on Climate Change, Canada’s emissions are reported through activities including stationary energy, transport, fugitive sources, agriculture, industrial processes, and waste disposal. Figure 6 provides a snapshot of the composition of Canada’s emissions by activity. As demonstrated, stationary energy and transportation are Canada’s key sources, accounting for 73% of total emissions in 2009.
FIGURE 6: CANADA’S GHG EMISSIONS BY ACTIVITY IN 2009
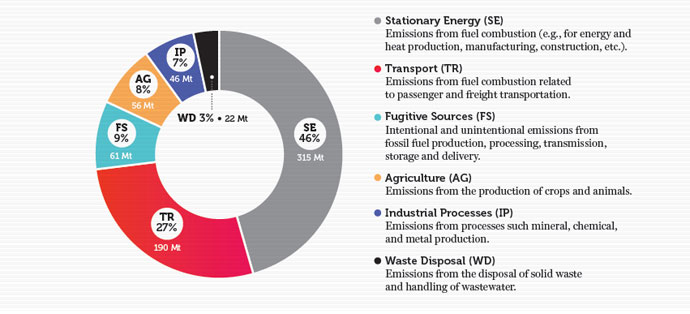
Source: Inputted data taken from Environment Canada 2011b
Stationary Energy: Emissions from fuel combustion (e.g., for energy and heat production, manufacturing, construction, etc.).
Transport: Emissions from fuel combustion related to passenger and freight transportation.
Fugitive Sources: Intentional and unintentional emissions from fossil fuel production, processing, transmission, storage and delivery.
Agriculture: Emissions from the production of crops and animals.
Industrial Processes: Emissions from processes such mineral, chemical, and metal production.
Waste: Emissions from the disposal of solid waste and handling of wastewater.
Activity-based reporting is widely used, but a sector-by-sector emissions breakdown is also sometimes employed, particularly in support of sector-based GHG regulations. Text box 2 provides an explanation of the difference between these approaches.
Text box 2: Measuring emissions sources
MEASURING
|
from the NIR to portray Canada’s emissions story since this data was available for 2009, while sector-based data was only available for 2008. We wished to use the most recently available data in both cases. However, when referring to the federal regulations being developed under a sectorby- sector approach we present data by economic sector which is from 2008. Since the completion of our report, the 2012 National Inventory Report has been released containing 2010 data and which for the first time now presents both activity-based economic |
sector-based emissions data. There is little material difference between the two sets of reports for total Canadian emissions reported from 2009 and 2010. Total emissions for Canada are virtually unchanged, rising only slightly from 2009 levels of 690 Mt CO2e to 692 Mt CO2e in 2010. And total emissions remain constant at 692 Mt CO2e whether they are calculated and presented on an activity-based or an economic sector-based approach. Canada’s 2020 target remains at 607 Mt CO2e in all cases which is the focus of the NRT’s modeling. |
Each year Environment Canada publishes emissions by activity in the National Inventory Report (NIR) on Greenhouse Gas Sources and Sinks in Canada to support its obligations as a signatory to the United Nations Framework Convention on Climate Change (UNFCCC). In contrast, Environment Canada’s Emissions Trends Report categorizes emissions by economic sector. Our report relies primarily on activity-based data from the NIR to portray Canada’s emissions story since this data was available for 2009, while sector-based data was only available for 2008. We wished to use the most recently available data in both cases. However, when referring to the federal regulations being developed under a sector-by-sector approach we present data by economic sector which is from 2008.
Since the completion of our report, the 2012 National Inventory Report has been released containing 2010 data and which for the first time now presents both activity-based economic sector-based emissions data. There is little material difference between the two sets of reports for total Canadian emissions reported from 2009 and 2010. Total emissions for Canada are virtually unchanged, rising only slightly from 2009 levels of 690 Mt CO2e to 692 Mt CO2e in 2010. And total emissions remain constant at 692 Mt CO2e whether they are calculated and presented on an activity-based or an economic sector-based approach. Canada’s 2020 target remains at 607 Mt CO2e in all cases which is the focus of the NRT’s modeling.
Energy emissions
In Canada, roughly 82% of emissions come from energy, which includes stationary combustion sources, transportation, and fugitive sources.29 From 1990 to 2009, energy-related GHG emissions grew by 98 Mt CO2e. This represents 87% of the total increase in GHG emissions over that period.
Stationary combustion alone represents almost half of Canada’s total emissions. A breakdown of emissions from stationary combustion is provided in Table 2. Electricity and heat generation as well as fossil fuel production and refining are the largest contributors. Stationary combustion is a growing source of emissions attributable to growth in fuel consumed by mining and oil and gas extraction. Emissions from these sectors leaped from 7 Mt CO2e in 1990 to 31 Mt CO2e in 2009, and from 3 Mt CO2e to 23 Mt CO2e in Alberta alone.30 In contrast, emissions from fuel consumed by construction, manufacturing industries, and agriculture and forestry have all decreased slightly since 1990, with a combined decrease of just over 14 Mt CO2e.
| Activity | 2009 Mt CO2e | 1990 Mt CO2e | % Change (1990–2009) |
|---|---|---|---|
| Electricity and heat generation | 98 | 92 | 7% |
| Fossil fuel production and refining | 64 | 51 | 25% |
| Manufacturing industries | 43 | 56 | -24% |
| Residential | 41 | 43 | -5% |
| Commercial and institutional | 36 | 26 | 40% |
| Mining and oil and gas extraction | 31 | 7 | 367% |
| Agriculture and forestry | 2 | 2 | -13% |
| Construction | 1 | 2 | -42% |
| Total | 315 | 278 | 13% |
Source: Inputted data taken from Environment Canada 2011b
Transportation is the second largest source of emissions and grew 30% between 1990 and 2009 in part because of a shift from light-duty gasoline vehicles such as cars to trucks, minivans, and sport-utility vehicles; increased vehicle usage overall; and greater use of heavy-duty diesel vehicles. Domestic aviation and marine emissions also fall into this category but have not contributed to this rise in emissions.31
Fugitive sources denote the intentional and unintentional releases of GHG emissions from coal mining and oil and natural gas exploration, production, transportation, and distribution. The vast majority of emissions are from fugitive oil and natural gas, in particular GHG emissions released through the venting process. Emissions from fugitive sources increased 44% since 1990 due primarily to growth in oil and gas extraction.32
Non-energy emitting activities
In 2009, Canada’s agricultural emissions contributed 8% of the country’s total GHG emissions. These emissions come primarily from the release of methane from the digestive processes of ruminants and of nitrous oxide from the soil. Agricultural emissions rose 19% since 1990 primarily because of growth in livestock populations and increased application of fertilizers.33
GHG emissions resulting from industrial processes include emissions from the production of industrial goods (as distinct from emissions from fuel consumed by manufacturing). Emissions from this source overall fell by 18% since 1990 because of a decline in emissions from adipic acid, aluminum, magnesium, and iron and steel production.34
Waste disposal produced 22 Mt CO2e in Canada in 2009, with the vast majority of emissions resulting from methane emissions from landfill waste management sites. Emissions from waste rose 16% since 1990. This rate of growth is lower than the population growth over that period due to higher use of landfill gas capture systems across the country.35
2.6 Climate policy moving forward
While this chapter summarized emissions policy and trends over the last two decades, Chapter 3 begins our current and forward assessment. Looking to the past, the largest sources of emissions growth are from oil and gas followed by waste and transportation.
Figure 7 shows an estimated 30% growth in the oil and gas sector from 2005 to 2020. Since it is the number-one growth sector, oil and gas emissions require priority policy considerations to address the rapid emissions increase. Looking ahead, our modelling that we set out in Chapter 4 shows the largest sources of emission growth remains from these three sectors: oil and gas, followed by transportation, and then waste.36 Additional policies that target these sectors hold a lot of promise to stabilize emissions over time.
FIGURE 7: FORECAST GROWTH IN EMISSIONS BY ECONOMIC SECTOR FROM 2005 TO 2020 (Mt CO2e)
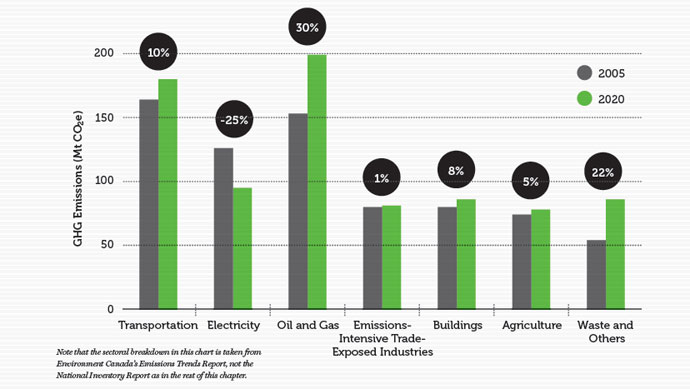
Source: Data taken from Environment Canada 2011a
Note that the sectoral breakdown in this chart is taken from Environment Canada’s Emissions Trends Report, not the National Inventory Report as in the rest of this chapter.
At this point in time, the federal government is proceeding with a sector-by-sector regulatory approach that includes both emissions performance standards and product performance standards. There are indicators that oil and gas will be the next priority sector once the coal-fired regulations are completed. Regulation of this sector will be challenging due to its strong growth as well as the diverse nature of Canada’s oil and gas industry where conventional drilling in Alberta has very different processes and GHG implications relative to offshore drilling in Newfoundland and Labrador.
At the same time, we can see that provinces are moving forward to manage emissions in their own jurisdictions by developing and implementing their own targets and measures, many of which are diverse and innovative. As Canada’s emissions profile shows, the sources of emissions vary substantially across the country and are heavily concentrated in stationary energy and transportation. The challenge to the political economy of designing and implementing a national climate policy plan that is both effective and equitable is sharply represented. An iterative and collaborative approach to federal and provincial policy development offers the benefit of avoiding costly overlap and promoting co-operation toward shared objectives. However, it is not apparent. The next chapter assesses the provincial climate change plans that have been set out to date.
[b] A report providing details on the history of climate policy in the U.S. is available upon request (Rabe 2012).
[1] The Changing Atmosphere: Implications for Global Security – Conference Statement 1988
[2] Jaccard et al. 2006
[3] Environment Canada 1990; ; as cited in Harrison 2012;
[4] Harrison 2012; Liberal Party of Canada 1993
[5] Environment Canada 1995
[6] Jaccard et al. 2006
[7] Environment Canada 2007
[8] Environment Canada 2008
[9] Environment Canada 2010a
[10] Environment Canada 2007
[11] Government of Canada 2000
[12] Government of Canada 2002
[13] Government of Canada 2005
[14] Number 016, 1st Session, 39th Parliament, Thursday, October 5 2006
[15] Environment Canada 2008
[16] Environment Canada 2011b
[17] Environment Canada 2010a
[18] Environment Canada 2011b
[19] Environment Canada NDa
[20] Environment Canada 2011d
[21] National Round Table on the Environment and the Economy 2011
[22] Government of Canada 2009
[23] Harrison 2012
[24] Lucas and Yearsley 2011
[25] Chalifour 2008
[26] Chalifour 2008
[27] Environment Canada 2011b
[28] Environment Canada 2011b
[29] Environment Canada 2011b
[30] Environment Canada 2011b
[31] Environment Canada 2011b
[32] Environment Canada 2011b
[33] Environment Canada 2011b
[34] Environment Canada 2011b
[35] Environment Canada 2011b
[36] Environment Canada 2011a; Climate Change and Emissions Management Corporation ND