Charting a Course – Chapter 3: Water Use by the Natural Resource Sectors: Past, Present, and Future
With an expanding economy and a growing international demand for Canada’s agricultural, energy, mining, and forest products, Canada’s natural resource sectors are well positioned to prosper. Recent economic forecasts for these sectors predict they will be one and a half times larger in 2030 than they are today. This means expected water use will grow too: the question is, “How much will water use rise?” This is a difficult question to answer as no comprehensive, and useful information base linking long-term economic growth to water use in Canada currently exists.
To better understand how a growing economy might affect long-term industrial and agricultural water use, the NRTEE developed a water intake forecast to 2030.9 This is important knowledge as future water-use demands are central to good water management. Forecasts help us understand if sustainable water-use risks might emerge. They also better inform an ongoing dialogue about water use by the sectors. Our consultations and research show that divergent views on water use exist across the country. Some believe that with economic development comes rapidly expanding water use, while others point to improvements in water-use intensity that are reducing overall water use despite increasing development.
The NRTEE research reveals that neither view is quite right. The public perception is that a significantly growing economy means that overall water use in the natural resource sector will also be significant. Industry is generally of the view that its water use intensity has improved — that it is using less water per production unit, not more. Our research demonstrates that, in fact, industry has steadily decoupled economic expansion from water use over the years. Our forecasts indicate that, on a national scale, water intake in the natural resource sectors may increase by just 3% between now and 2030, even though economic production could increase by almost 40% overall for the sectors in this study. This of course masks some sector and regional variation, as localized demands for water use can be expected to grow over time, which may uncover significant challenges.
WATER-USE DEFINITIONS
- Water intake. Water intake, also referred to in this report as water use, is the amount of water that a sector purchases from a public utility or withdraws from a natural water body.
- Recirculation. Recirculation is the volume of water that the sector reuses in its processes.
- Gross water use. Gross water use is the total amount of water used by a sector: the sum of intake and recirculated water.
- Discharge. Water that is no longer required is discharged, often back into the water course where it was taken from.
- Consumption. Water consumption is the difference between the amount of water taken in and the amount of water discharged.
- Water-use intensity. Water intensity is the water intake per unit of production or per unit of economic output. To be able to compare intensities across sectors, for the purposes of this report, water-use intensity is calculated by dividing the water intake by the historical value of production in the sector.
- Costs of water use. Costs associated with acquiring water including public utility costs, operation and maintenance, as well as treatment of intake, recirculated, and discharged water.
Our forecast of water use out to 2030 is the product of two factors: first, the water-use intensity or how much water is required to produce a product; and second, how much the sector will grow, or a forecast of economic production. This chapter begins by showing historical water use by sector and province. From this we take our estimates of historical water intake and couple them with a long-term economic forecast to predict water demands out to 2030, on both national and sector bases. As this is the first time such analysis has been conducted, we set out our water forecasts in more detail and outline our methods. It is important to remember that this is one scenario, which highlights potential water intake trends into the future; it is meant to be illustrative, not definitive, of what might occur with water use in this country. The NRTEE recognizes that water forecasts are likely most useful on a watershed basis, but data does not exist to allow for such an analysis.
HISTORICAL WATER USE, ECONOMIC OUTPUT, AND WATER INTENSITY
Developing a water-use forecast starts with knowing the water intake of the sectors. Statistics Canada provides historical data on water use by industry from 1981 to 2005, for the agriculture, manufacturing, mining, and thermal electric power generation sectors.* This data is derived from five different years of surveys.10,† Historical water use in the agricultural sector is modelled by Statistics Canada‡ with a recent survey in 2005. Water use in the oil and gas sector is more uncertain, with water-use data beginning in 2000 and not available for all regions of Canada.11,§ Nevertheless, using the most recent and best available data together enables a clear picture to emerge.
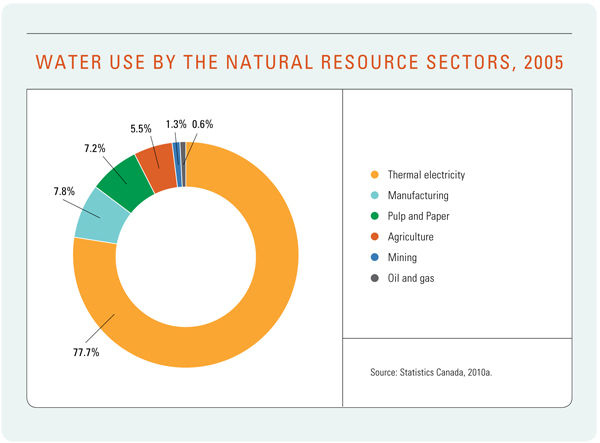
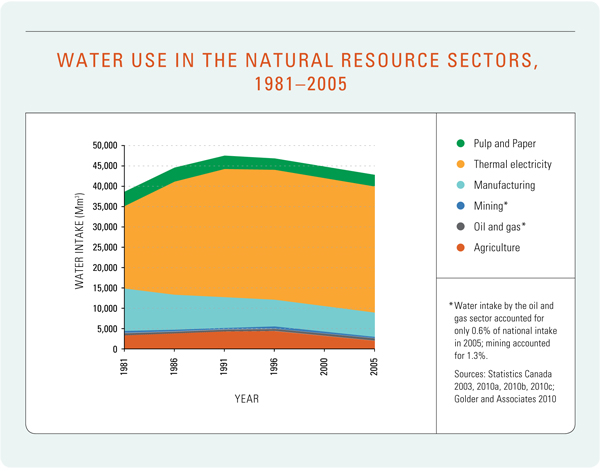
Statistics Canada12 estimates that the total water intake of Canada’s residential, commercial, institutional, and industrial sectors was 42 km3 in 2005.¶ Of this total, water use in the agriculture, oil and gas extraction, mining, manufacturing, and thermal electric power generation sectors accounted for approximately 36 km3, or 86%. The sectors studied in our report are the largest water users in the country. Of the water intake by the natural resource sectors, the distribution is as follows: the thermal electric power generation sector was the largest water user (77.7% of water intake), followed by manufacturing (7.8 %), pulp and paper (7.2%), agriculture (5.5%), mining (1.3%), and oil and gas (0.6 %) (Figure 2).
* Hydroelectricity is not included in this water forecast study because of the qualitatively different nature of water used for this purpose
— it represents a flow-through use of water compared to the active intake, treatment, and discharge performed by other sectors.
† Industrial Water Use Survey, 1981, 1986, 1991, 1996, and 2005.
‡ 1996 from Statistics Canada (2003); 2001 from Statistics Canada 2007; and 2005 from Statistics Canada (2010a)
§ While these datasets are useful, the small number of observations makes it difficult for those interested in developing water forecasts to identify the cause of observed trends.
¶ One kilometer cubed (km3) of water is equal to one thousand million cubic meters; in other words,1 km = 1,000 Mm3, and 1 Mm3 = 1,000,000 mM3.
FIGURE 2
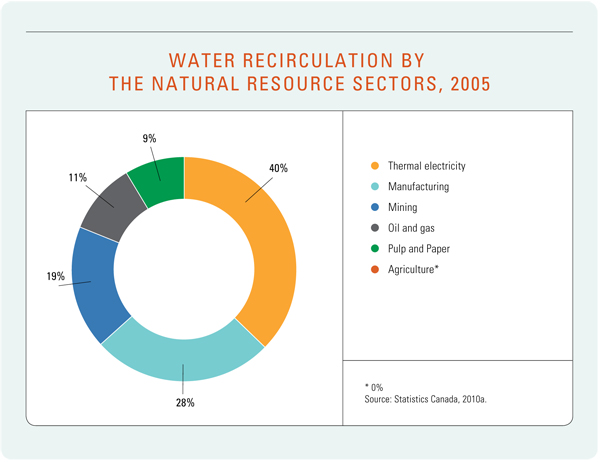
Water recirculation is an important component of water use by many of the natural resource sectors. Recirculating water lessens overall water intake. Thermal electricity recirculates the largest share of total water on a national basis followed by the manufacturing and mining sectors (Figure 3).
FIGURE 3
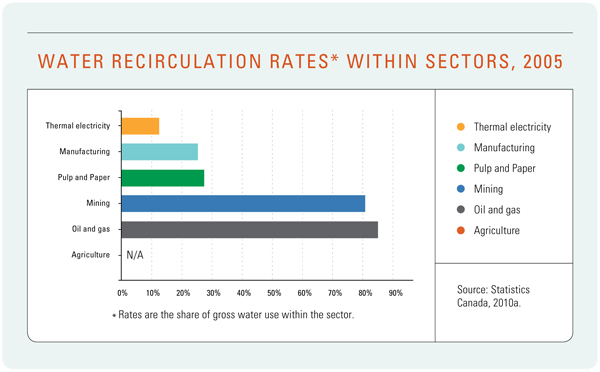
A different story emerges when comparing rates of recirculation across sectors – that is how much water is recirculated within a sector, when compared with other natural resource sectors’ recirculation. On that basis, thermal electricity recirculates the least of all the sectors (Figure 4). This contrasts with much higher recirculation rates in oil and gas (85%) and mining (81%).
FIGURE 4
Historical water intake trends between 1981 and 2005 show an overall increase of about 13% over the 24-year period. Water intake plateaus in 1991 at about 26% above 1981 levels, but then trends downward to 2005 (Figure 5). For the past 15 years water intake by many sectors has fallen, with the greatest reductions found in the agriculture and mining sectors.
FIGURE 5
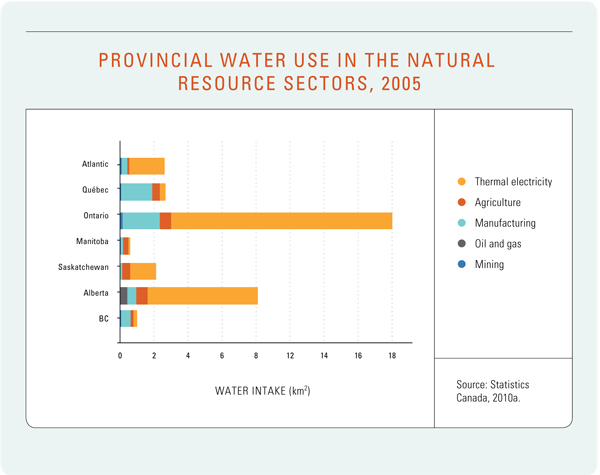
Provincially, the largest water use is concentrated in Ontario and Alberta, reflecting the large share of thermal power in the provincial economies (Figure 6). Large agriculture and manufacturing water use also contribute to Ontario’s high share of national water use. In Alberta, thermal electricity dominates water use, followed by agriculture and manufacturing. Oil and gas uses less than 5% of the water in Alberta. With hydroelectricity not covered in this study, manufacturing dominates intake in Québec, the third largest provincial water user as defined in our study. Thermal electricity water use predominates in Saskatchewan and Atlantic Canada, but agricultural water use is higher in Saskatchewan. British Columbia’s water intake is primarily concentrated in thermal electricity and manufacturing, with each accounting for about 40% intake. Finally, in 2005, Manitoba had the lowest water intake nationally, with agriculture accounting for over 50% of total natural resource sector use within the province.
FIGURE 6
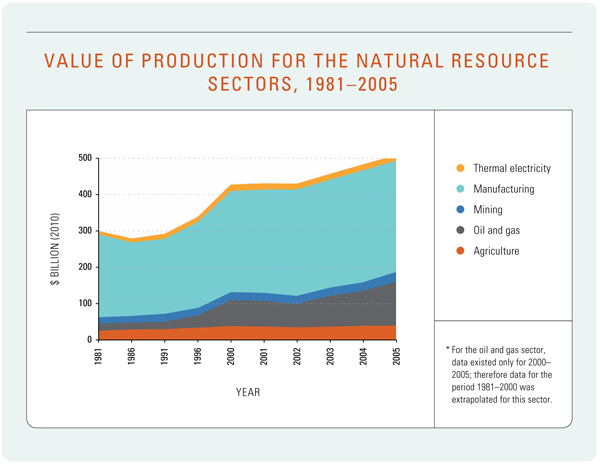
Having identified historical trends in water intake, we can now examine water-use intensity. This requires first defining historical economic activity within the sectors. Despite an economic slowdown in the early 1980s, overall output has climbed steadily to be about to be about 70% above 1981 levels in 2005. The rate of increase in these sectors was much faster than the rate of increase of Canada’s total economy, which grew by about 40% over the same period. The oil and gas sector grew even more, with an increase of greater than six times 1981 levels. Figure 7 shows the value of production for each of the sectors to the economy, as well as the increase in real terms (2010 dollars) of each from 1981 to 2005.* Manufacturing dominates the sectors accounting for 60% of all production value in this time series.
* The value of production data is taken from Statistics Canada’s 2005 System of National Accounts where national and provincial output data is disaggregated by commodity, sector, and region. Disaggregated output for the electricity and oil and gas sectors was obtained from Natural Resource Canada 2011.
FIGURE 7
Now knowing both the historical water intake and the historical value of production, we can then calculate each sector’s water-use intensity* — defined here as water intake per dollar of production. This is important to determine, as we forecast water use we need to know the change in water-use intensity over time to estimate how water intake in a growing economy changes.
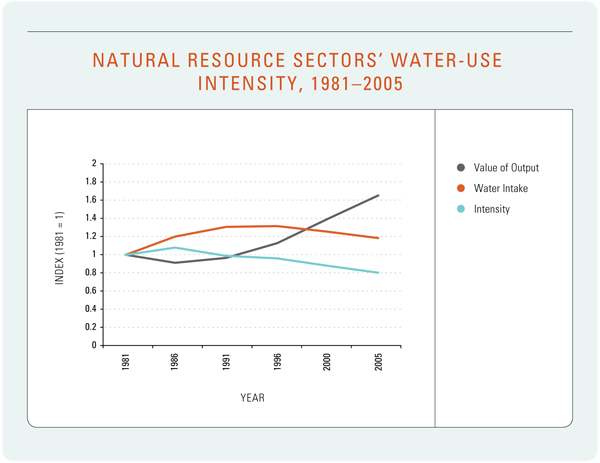
With the economic activity of the natural resource sectors expanding rapidly and water intake declining over time, it is not surprising that water-use intensity has fallen. Since 1981, the natural resource sectors have steadily decoupled economic growth from water use, with a decline of about 20% for every dollar of output (Figure 8). While this is an important finding, not enough research has been completed in Canada to fully explain the decline in water-use intensity. We know, however, that important drivers include technological change, changes in the composition of industrial sectors, and changing processes for internal water recirculation.
* Using this definition of water-use intensity allows for a comparison across sectors. If defined as water intake per unit of production, a sectoral comparison would be impossible.
FIGURE 8
Each sector’s water use, including water intensity, water intake, and economic output, is discussed separately below.*
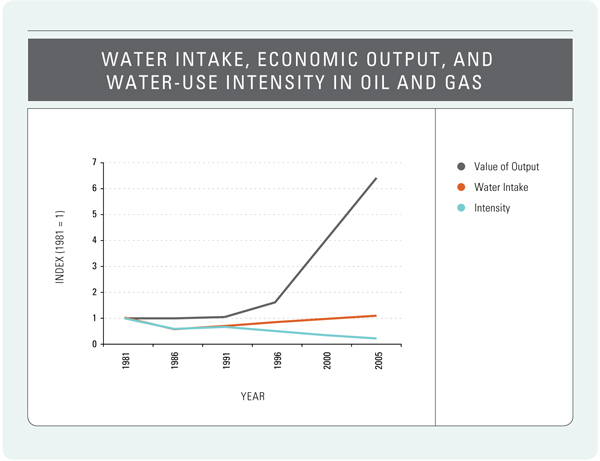
* or ease of comparison the values of economic output, water intake, and water-use intensity are compared using an index where 1981=1, the starting point of comparison. Economic output from the oil and gas sector has grown so rapidly that it requires the index to increase to 7.
THERMAL ELECTRIC POWER GENERATION
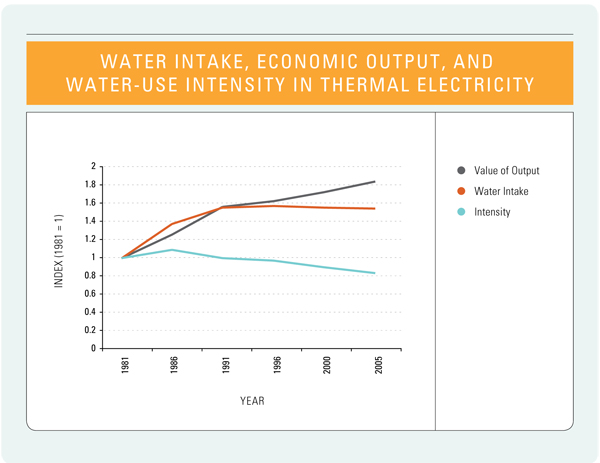
Thermal electric power generation in Canada takes in more water than any other use, primarily from water bodies in Ontario, Alberta, and Saskatchewan. This sector accounted for 66% of the total national intake in 2005; its water use increased by about 53% from 1981 to 2005 (Figure 9). Thermal electric power generation includes conventional fossil fuel and nuclear power generation, which use approximately 140 litres and 205 litres, respectively, to produce one kilowatt-hour of electricity.13 While a small portion of the water is converted to steam and used to spin an electric generator, most of the water is used for cooling. This water is then either recirculated or discharged. In 2005, approximately 2.5% of this sector’s water intake was consumed primarily from the loss of steam in the cooling process.
FIGURE 9
The economic value of this sector’s output in 2005 was $15.6 billion, or about 80% greater than 1981. This increase in value, coupled with rising water intake (53%), results in thermal having the highest water-use intensity of any sector. In 2005 this sector had the greatest water intake in Canada but produced only 3.1% of total national economic output. As a result, water-use intensity fell by 16% from 1981 to 2005.
MANUFACTURING
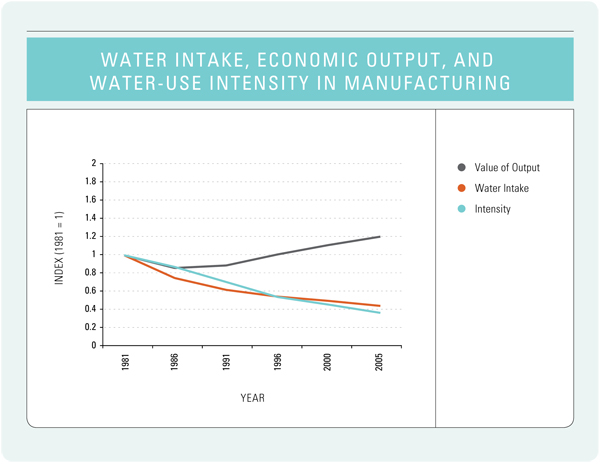
Manufacturing remained the second largest water user of the natural resource sectors, accounting for almost 13% of national intake in 2005; however, this intake has fallen by half since 1981 (Figure 10). In the manufacturing sector water can be used many ways — as a raw material to make pulp or beverages, a solvent for removing undesired materials, or a transport agent to move products. The largest manufacturing water users are paper and primary metal — making up 48% and 29% respectively of manufacturing water use in 2005.14
FIGURE 10
Despite a drop in economic output from 1981 to 1986 (due primarily to a 39% drop in output in petroleum and coal products), production in manufacturing has risen 34% since 1981. This combination of rising production and rapidly falling water intake has resulted in a dramatic reduction in water-use intensity; since 1981, the water-use intensity has fallen by more than half (Figure 10).
Given the diversity of production in manufacturing, it is not surprising that the water-use intensity of some subsectors is high while for others it is low. Those with high water-use intensity include pulp and paper (Figure 11), primary metal, and chemical manufacturing; those with low water-use intensity include non-metallic mineral product, petroleum and coal, and food manufacturing. Food manufacturing was the only subsector that did not reduce its water intake from 1981 to 2005. The most dramatic reduction in water intake occurred in chemical manufacturing, which reduced its water use six-fold from a share of 34% of overall manufacturing water intake to 9%.
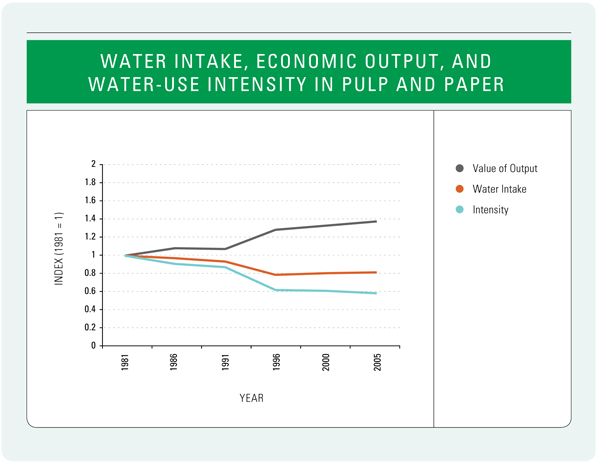
The pulp and paper subsector is considered to be part of the manufacturing sector based on Statistics Canada’s data collection. Its water use represents approximately half of the manufacturing sector’s total water intake, making the pulp and paper subsector one of the more water-intensive subsectors (Figure 11). From 1981 to 2005, the value of economic output in pulp and paper saw a gradual increase, in comparison with a reduction of water intake of about 20% over the same time period. As a result, the water-use intensity of the pulp and paper subsector has gradually declined by about 40% during this period.
FIGURE 11
AGRICULTURE
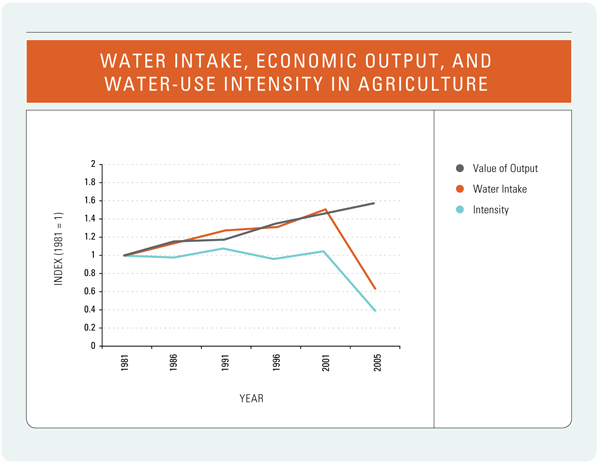
In 2005, water used for agriculture accounted for 5% of national intake. Included in agriculture are two subsectors: crop and animal production. Agricultural water use is primarily for irrigation (84%) and livestock watering (14%). In contrast to the industrial sectors, much of the water use in agriculture is considered consumptive due to evaporation, transpiration, and loss to groundwater; therefore only one-quarter of the intake water is returned to its source. Water intake in agriculture steadily increased by about 50% from 1981 to 2001, but then decreased substantially from 2001 to 2005 by 57%, resulting in about 38% below 1981 levels (Figure 12).
The value of agricultural production rose steadily from $24.5 billion in 1981 to $38.6 billion in 2005. This, in combination with the significant drop in water intake between 2001 and 2005, had the effect of driving down water-use intensity by 60% between 1981 and 2005, with the most notable decrease occurring since 2001.
FIGURE 12
Despite being equal in the value of output to animal production historically, crop production used 95% of the water in the agriculture sector. From 1981 to 2001, water use and economic growth increased proportionally causing the water intensity of the crop production sector to remain relatively stable. However, in 2005, water use in crop production dropped to one-third of what it was reported to be in 2001. This drop in water use per unit of output was likely caused by a large decrease in the amount of water needed for crop irrigation due to higher precipitation that year. This reduction in water intake in 2005 caused the water intensity to drop by 70% of its 1981 value.
It is difficult to explain improvements to water intensity in agriculture. However, case studies of the Okanagan Valley in British Columbia, where water intensities have improved significantly, suggest possible reasons: weather and climatic conditions, adoption of newer technologies and best management practices, a change to more drought-resistance crops (less water intensive), and decommissioning of previously irrigated lands.15
OIL AND GAS
Oil and gas extraction is a relatively small water user nationally, with the majority of current production and related water use located in Alberta. Water use is found predominantly in nonconventional oil and gas extraction, including the oil sands subsector. The overall oil and gas sector’s water intake showed an uneven trend between 2001 and 2005, with both increases and decreases. Subsector variation is evident with some facing decline in the period (the water intake for conventional oil dropped 18%) and some trending up (water intake in unconventional gas rose 68%). Water-use data was only available from 2001 onward, and so water use prior to 2001 is estimated based on this data.
Overall, the water-use intensity of the oil and gas sector has been dropping over time (Figure 13). The oil and gas sector as a whole has the lowest water-use intensity of the sectors covered in this study due to its relatively large economic output (23% of output of all sectors) compared with a relatively small amount of water use (0.6% of water intake of sectors covered in this study). In 2005 the largest water user in this sector was oil sands mining, which used 66% of total water intake by the sector, but only accounted for 12% of the sector’s overall economic output, resulting in the highest water-use intensity of the subsectors. In contrast, conventional oil and natural gas, which made up the majority of the economic output in this sector at 64% in 2005, was one of the lowest water users in terms of intake (27%) in 2005, resulting in the lowest water-use intensity.
FIGURE 13
MINING
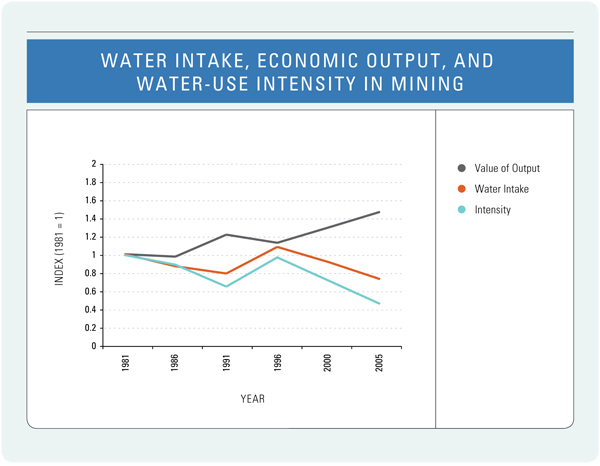
On an intake basis, the mining sector is a very small water user, accounting for just 1% of national water intake in 2005. This sector includes coal, metal ore, and non-metallic mineral mining. Water is used to cool drill bits, separate ore from the mined rock, wash the extracted ore, and remove any unwanted material. The mining sector has one of the highest recirculation rates of all sectors. Statistics Canada indicates that the mining sector actually returns more water to the environment than it extracts, due to the discharge of water that accumulates on the mine site, often due to interception of groundwater.16
Overall, water intake has been trending downward in mining, as the sector has steadily reduced its intake from 1981 to 2005, with the exception of an increase in 1996. However, the sector reduced its intake from 1996 to 2005 by 33%. Over the same period, the value of production rose by about 48%, which translates into a significant drop in water-use intensity for the mining sector (Figure 14). All mining subsectors show decreased water-use intensity since 1981. While the trend is down, there has been some variation such as that observed between 1996 and 2005. Economic output for all the subsectors increased from 1981 to 2005. As a result, water-use intensity fell overall from 1981 to 2005 in all subsectors despite an observed intensity increase in 1996.
FIGURE 14
WATER FORECASTS FOR THE NATURAL RESOURCE SECTORS
The 2030 forecast of water intake requires first, a forecast of water-use intensity and second, a forecast of economic growth. Each of these is discussed below.
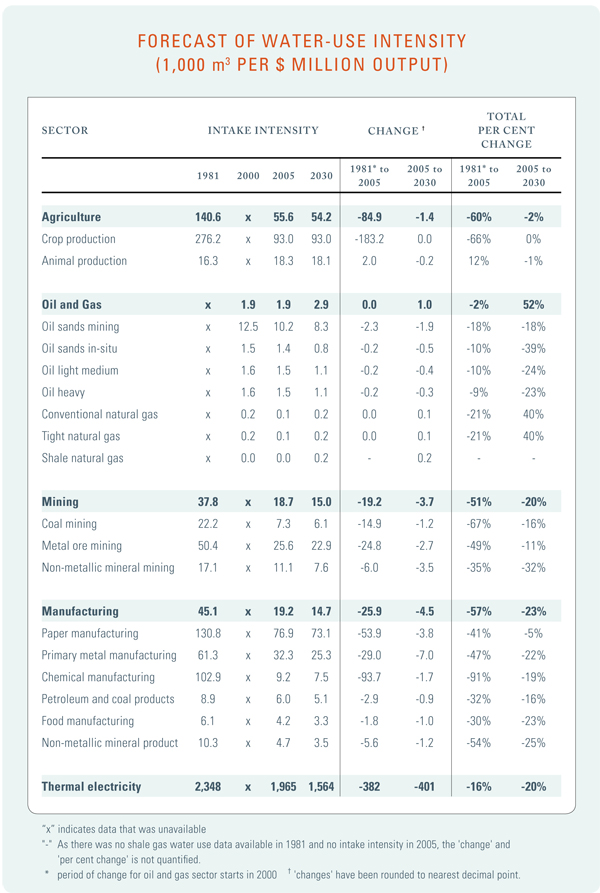
WATER-USE INTENSITY FORECASTS
In order to forecast water use, it was necessary to first estimate what each sector’s water-use intensity might be out to 2030. We did so by using the historical water-use intensity trends presented in the previous section for each sector and subsector. There are some important assumptions used in these intensity forecasts, and some important aspects of the forecasts worth noting:
- Agriculture. The overall historical water-use intensity of the agriculture sector improved between 1981 and 2005 with a significant reduction in intensity of about 60%. However, with the importance of irrigation to water intake, and with the relatively stable historical water-use intensity in the crop production sector, the 2005 water-use intensity is used as the future water-use intensity through to 2030.
- Oil and Gas Extraction. The water-use intensity for the oil and gas sector overall is predicted to increase by 52%; however, there is substantial variation between the subsectors. This forecast assumption flows from the following explanation:
- Based on the historical trend, conventional, oil sands mining and oil sand in situ production are forecast to continue improving their water-use intensity. The in situ oil subsector is forecasted to have the largest improvement in fresh water-use intensity, based upon a significant improvement in efficiency by 201517, after which we assume that water-use intensity remains to 2030.
- Due to a lack of data on water use in the different types of natural gas production, the water-use intensity of all natural gas production is forecast to increase by 1.6% per year from 2005 to 2030 — a reduction in the growth of 2.2% annually from 2000 to 2005. This increase in water intensity may be due to the transition from conventional gas production to tight and shale gas resources that are anticipated to require significant water quantities.
Therefore, despite falling or stable water-use intensities for each individual oil and gas sector, overall water-use intensity is forecast to increase 52% by 2030 in our scenarios, due to an increase in the output of the oil sectors compared to natural gas. From 2005 to 2030, the share of output will shift from 52% oil and 48% natural gas to 74% oil and 26% natural gas. Since the water-use intensity of oil production is much higher than natural gas production, the overall water-use intensity of the oil and gas sector increases by 52%.
- Manufacturing. Water-use intensity declined for all the manufacturing subsectors to 2005, and is forecast to continue to decline to 2030. Water intensity in the pulp and paper subsector declined significantly between 1981 and 1996 but then remained stable thereafter to 2005. We extrapolate a somewhat flat water-use forecast for the manufacturing sector as a whole to 2030.
- Mining. Given the general decline in water-use intensity overall in the mining sector, the water-use intensity is assumed to continue to decrease out to 2030; however, notable differences exist at the subsector level.
- Thermal Electric Power. Based on historical data, the water-use intensity for thermal electric power generation is forecast to continue to decline by 20% by 2030.
An important caveat to note is that the water-use intensity for each sector and some subsectors can vary substantially from region to region; as such, the NRTEE recognizes that the use of one value for water-use intensity in our future scenario is not representative of regional differences that likely exist.
Table 1 provides subsector details for the water-use intensity forecasts. Further explanation of the calculation of the water-use intensities is provided in Appendix 3.
TABLE 1
ECONOMIC GROWTH FORECAST
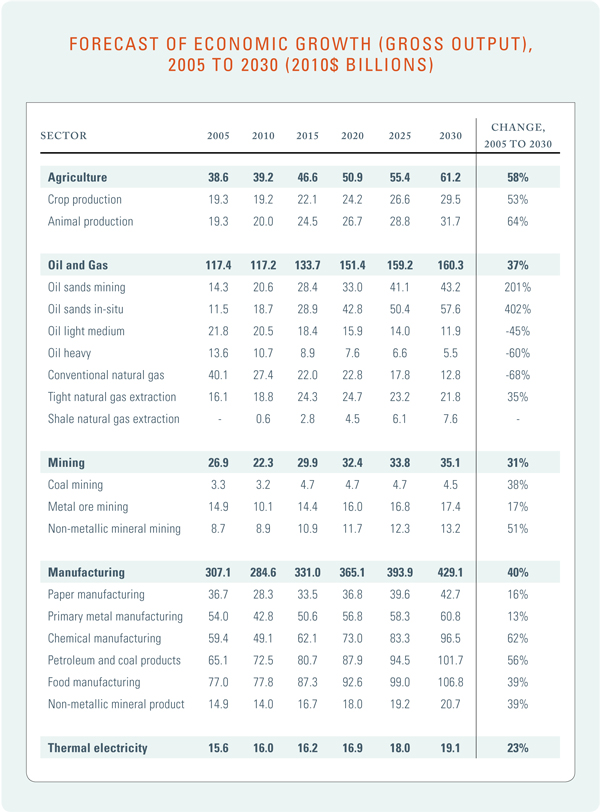
The forecast of economic growth out to 2030 is determined by obtaining forecasts of growth rates for the subsectors and applying these growth rates to the 2005 base year economic data that is nationally available.18 For most sectors, growth projections out to 2030 are from Informetrica.19 A disaggregated forecast for the oil and gas sector was derived from the Canadian Association of Petroleum Producers20 and the National Energy Board.21 A forecast of growth in the electricity sector was derived from original modelling.*
* The CIMS model is a technologically explicit representation of the Canadian energy–economy system. The forecast of output for the electricity generation sector is based on the calculated demand from the Canadian economy.
Most sectors are expected to increase their gross output by 2030. While the oil sands in-situ and oil sands mining sectors are forecast to grow the fastest of any subsector of the economy, the forecast reduction in conventional oil and gas production will limit the increase in the overall oil and gas sector to that of 37% by 2030. Next to oil sands, animal production is forecast to grow the fastest at 64%, followed by chemical manufacturing, petroleum and coal product manufacturing, and crop production. Shale gas is expected to grow its share of natural gas output from 0% in 2005 to 18% by 2030. The mining and manufacturing sectors were the hardest hit by the recent economic downturn, both showing a decline in output from 2005 to 2010. However, both sectors are anticipated to increase production past 2005 levels by 2015. Table 2 provides further details of the subsector economic output forecasts to 2030.
TABLE 2
WATER INTAKE FORECASTS
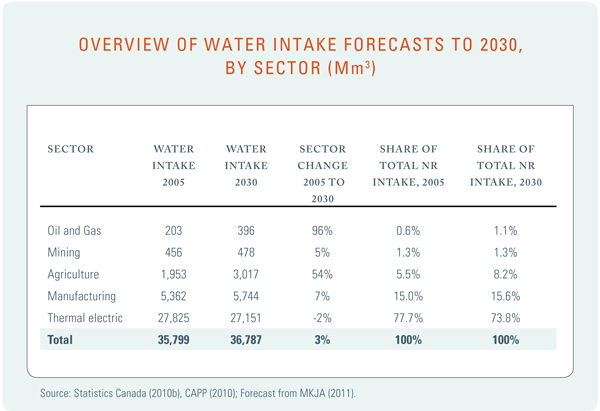
By combining the forecast of water-use intensity and economic forecasts for the sectors, we estimate that overall water intake will rise by about 3% on a national basis, from 35,799 Mm3 in 2005 to 36,787 Mm3 in 2030. This overall increase is largely due to intake increases by agriculture and oil and gas (Table 3).
TABLE 3
Due to the relatively small improvement forecasted for water-use intensity from 2015 to 2030 in agriculture and oil and gas (specifically oil sands mining and oil sand in-situ), the water intake increases with the high economic growth rates forecast in these sectors. Keep in mind, however, that these forecast water intakes for the two sectors, relative to the total intake by the natural resource sectors, are somewhat modest. For example, while the oil and gas sector’s water intake is forecast to increase by 96% by 2030, the sector’s water intake will still only account for about 1% of the national water intake by all natural resource sectors combined. However, this represents a larger share of water intake in the regional watersheds.
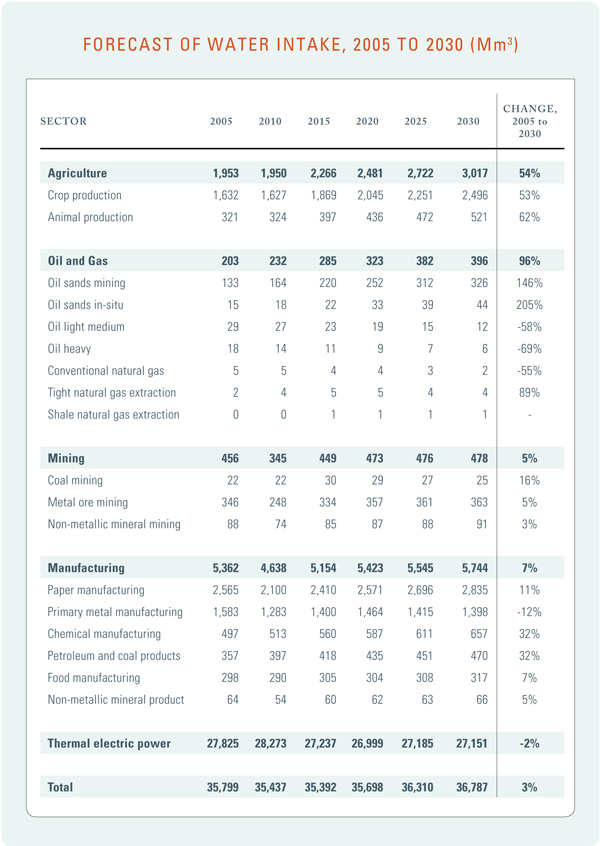
While most sectors’ water intake is forecast to increase by 2030, some subsectors are expected to reduce their water intake. Conventional oil and gas production are expected to reduce their water intake due primarily to a reduction in the economic output of these sectors. Primary metal manufacturing and thermal electric power generation are expected to experience a decline in water intake due to decreasing water use intensities.
Table 4 shows the details of the water-intake forecasts by sector and subsector. This table also shows water intake compared to the historical trend.
TABLE 4
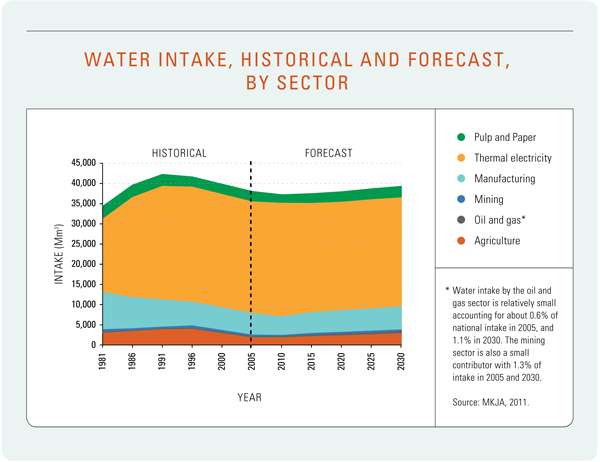
The increasing economic activity is predicted to exceed the rate of improvement of water-use intensity and result in an increase in water intake in all sectors, except thermal electric power generation from 2005 to 2030. Subsector variation exists within these sector averages (Table 4). Thermal electric power generation remains the largest water user in Canada, followed by manufacturing and agriculture in 2030 (Figure 15). However, thermal power’s water intake is forecast to decline by about 2%, resulting in a national overall increase of 3%.
FIGURE 15
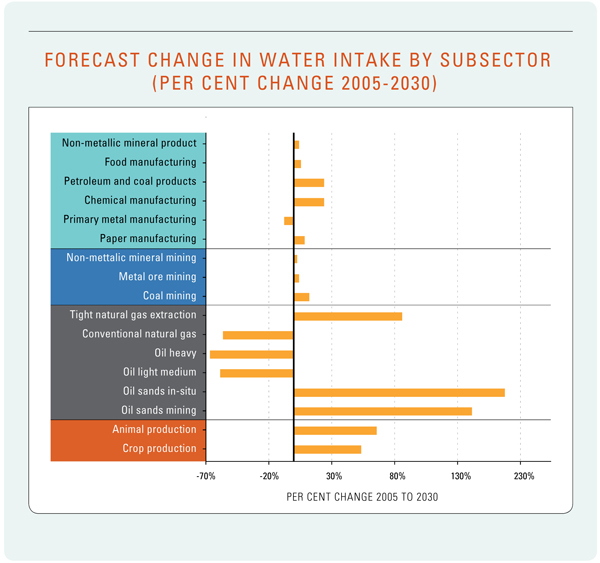
Although our forecasts predict that overall national water use remains fairly constant from now until 2030, subsector variations of water-use intake may be significant (Figure 16). The water-use intake for some subsectors declines, including conventional oil and gas and thermal electricity, while the water-use intake for others, including the non-conventional oil and gas subsectors, grows significantly. Oil and gas is regionally concentrated, implying perhaps localized water-use pressures. Agricultural water intake is likely to increase, and being geographically dispersed, the sector could also face increased water pressure over time. Thus the small overall forecast increase in water use may mask some significant sector and regional variation.
FIGURE 16
SUMMARY
Our analysis reveals that the natural resource sectors have steadily decoupled their economic growth from water intake and use. Despite historical economic gains by most sectors, water intake has not increased at the same rate as their economic growth resulting in improvements of their water-use intensity.
Water forecasts to 2030, for all natural resource sectors combined on a national level, suggest minor water intake increases. However this national picture likely masks regional and sectoral differences that may exist, and must be further investigated in a regional context.
We presented our forecasts to industry representatives to test their validity and conducted technology reviews to look for future improvements in water technologies. Despite this, our forecasts have some limitations, primarily because the future trends were derived from historical water use. Any number of future drivers could alter these forecasts, notably step changes in improved water use through technology deployment. Future work on forecasting at a provincial, as well as watershed basis, would be even more insightful. Adopting a watershed approach to management makes more sense when addressing supply and demand issues. Securing reliable data at that level will provide a clearer, more detailed picture of water-use trends and pressures and assist private and public water managers make decisions.
____________
Footnotes
10 Statistics Canada 2010b, 2010c
15 Policy Research Initiative (PRI) 2005
